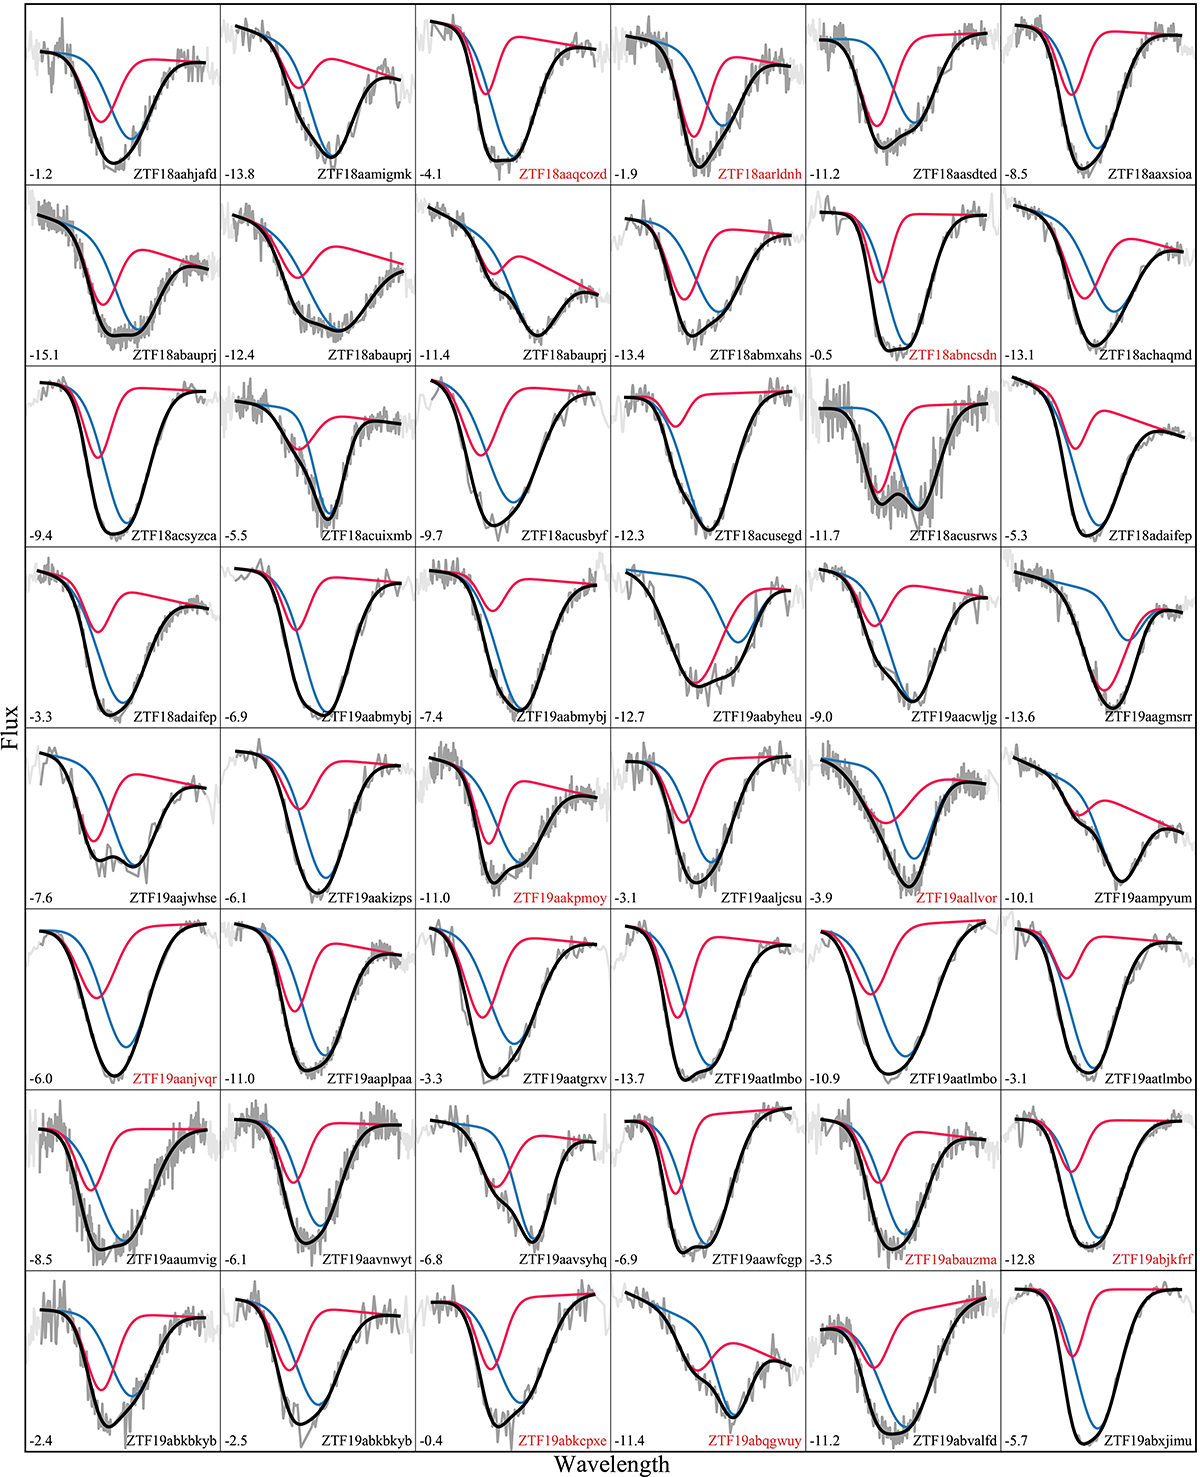
Fig. B.1.
Download original image
Best fits to the 85 ZTF DR2 spectra in the sample identified as having an HV component. The phase and SN ZTF name are indicated in each panel. The continuum regions are highlighted in blue and red, the overall fits are shown by the solid black curves, and the individual PV and HV components are shown by the blue and pink curves. Red SN names indicate those that were subsequently cut in the creation of the low-bias sample.
Current usage metrics show cumulative count of Article Views (full-text article views including HTML views, PDF and ePub downloads, according to the available data) and Abstracts Views on Vision4Press platform.
Data correspond to usage on the plateform after 2015. The current usage metrics is available 48-96 hours after online publication and is updated daily on week days.
Initial download of the metrics may take a while.