Fig. 17.
Download original image
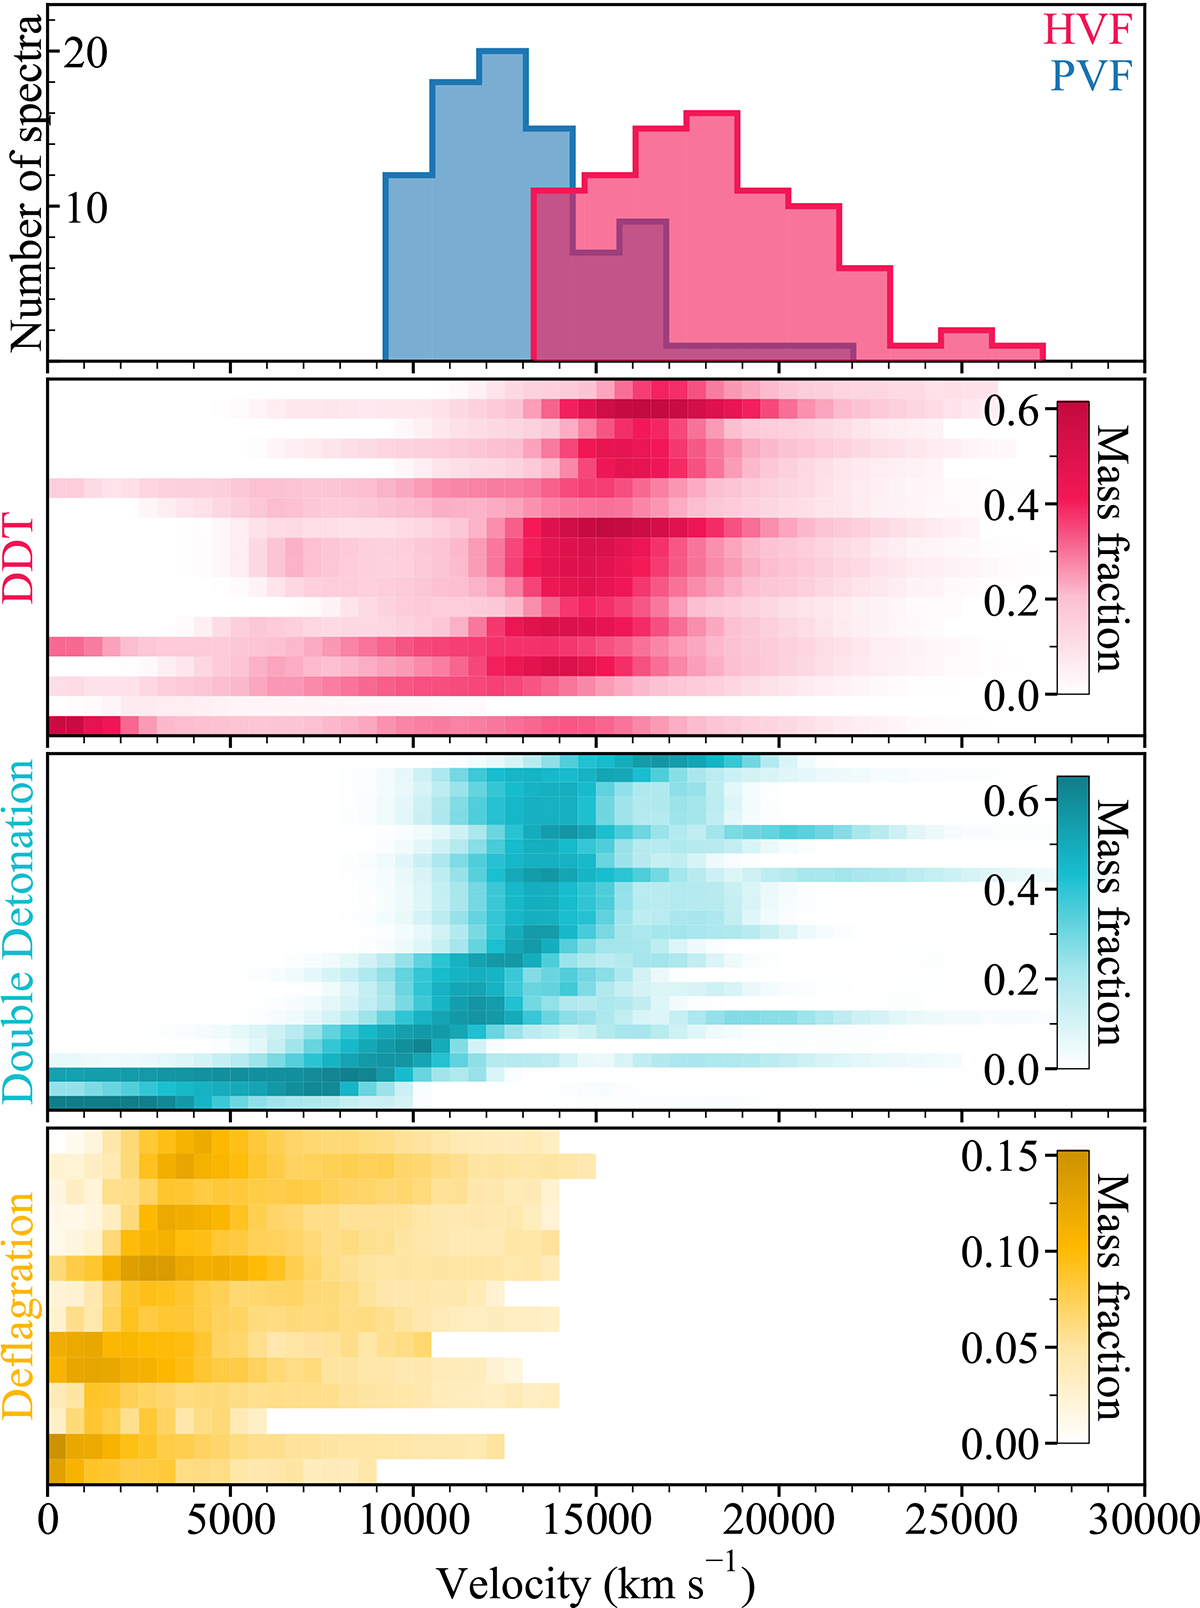
Comparison of the measured velocity distributions of PV and HV components in our sample for spectra identified as having both components (top) against the distributions of silicon from a number of theoretical explosion models from the HESMA archive (Kromer et al. 2017). Each of the three panels corresponds to a different explosion mechanism, with each row of the colour plot as an individual, unique model.
Current usage metrics show cumulative count of Article Views (full-text article views including HTML views, PDF and ePub downloads, according to the available data) and Abstracts Views on Vision4Press platform.
Data correspond to usage on the plateform after 2015. The current usage metrics is available 48-96 hours after online publication and is updated daily on week days.
Initial download of the metrics may take a while.