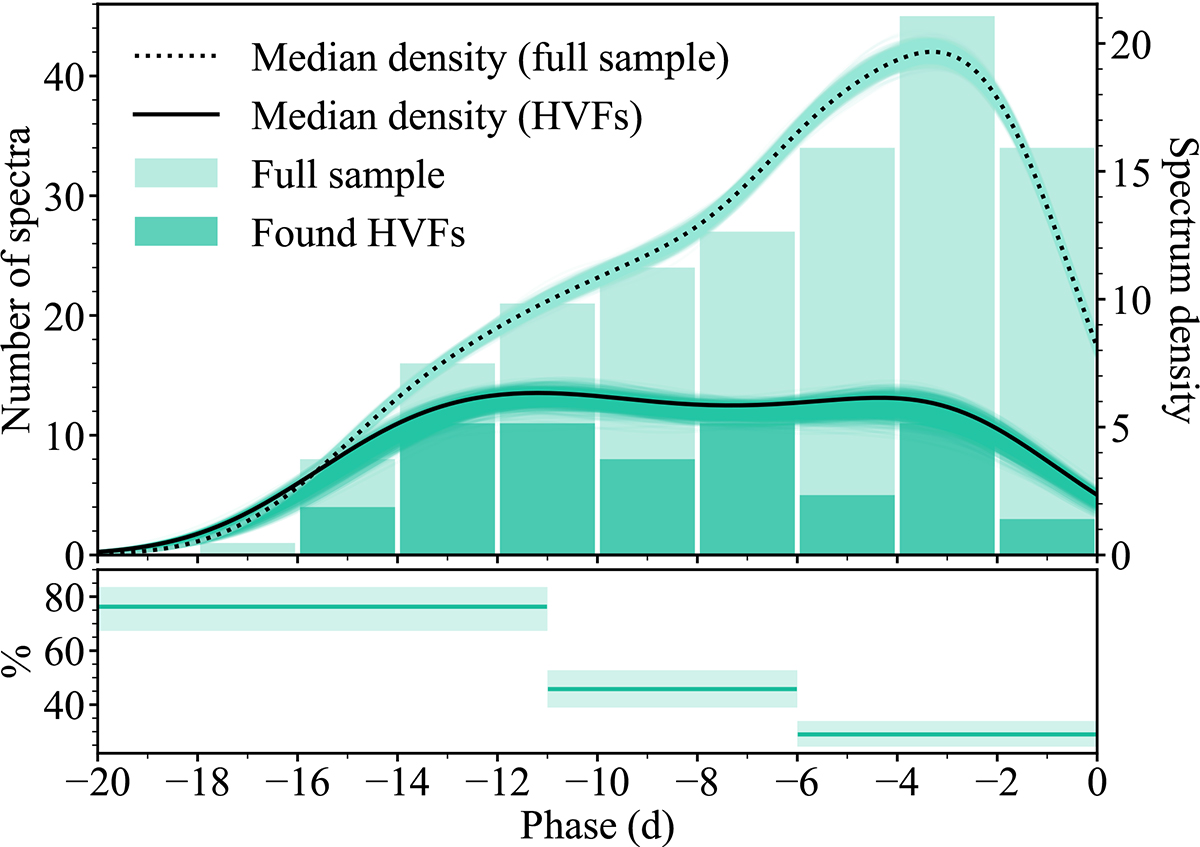
Fig. 12.
Download original image
Phase histogram for the 64 HVF spectra compared to the full 210 low-bias spectral sample. The solid black curve presents the median HVF spectrum density after correcting for the detection efficiency of our classification method, with the dotted black curve as the density of the full 210 spectra. The individual green curves (dark for HVF and pale for the full sample) correspond to 1000 iterations of sampling the Δv and phase values from their individual measurement distributions, rescaling the HVF distribution, and recalculating these density functions.
Current usage metrics show cumulative count of Article Views (full-text article views including HTML views, PDF and ePub downloads, according to the available data) and Abstracts Views on Vision4Press platform.
Data correspond to usage on the plateform after 2015. The current usage metrics is available 48-96 hours after online publication and is updated daily on week days.
Initial download of the metrics may take a while.