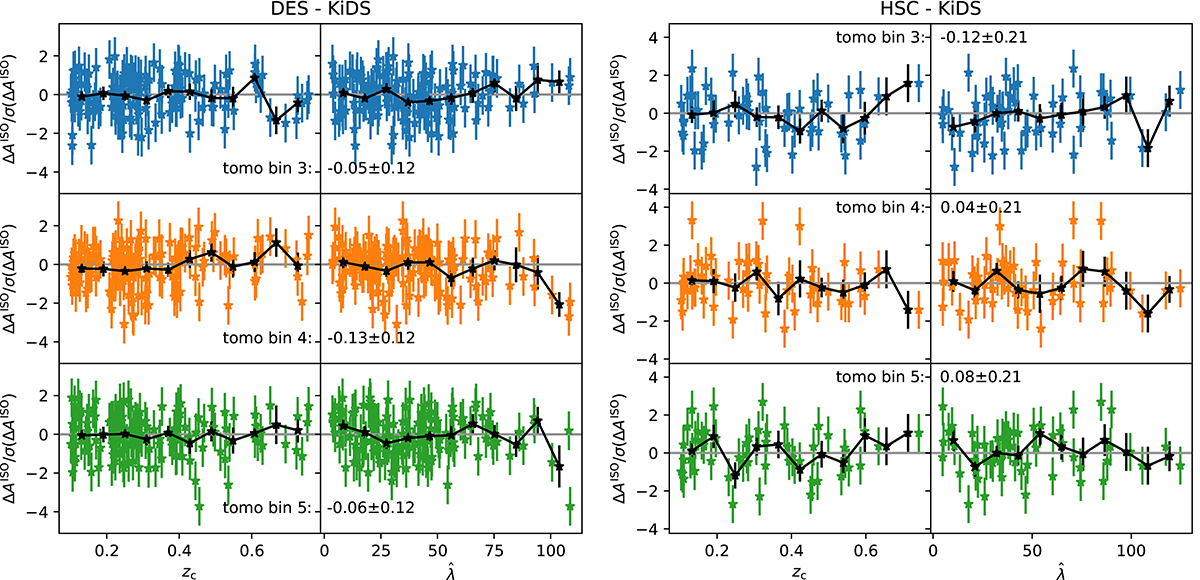
Fig. 14.
Download original image
Difference in the amplitude of the isothermal sphere shear profile models fitted to clusters with coverage by DES and KiDS (HSC and KiDS) in the left (right) panel plotted relative to the uncertainty of this difference and as a function of cluster redshift and richness (columns) for the different KiDS tomographic redshift bins (rows). We found excellent overall agreement, while no richness or redshift trends are evident from visual inspection, also after binning (black points).
Current usage metrics show cumulative count of Article Views (full-text article views including HTML views, PDF and ePub downloads, according to the available data) and Abstracts Views on Vision4Press platform.
Data correspond to usage on the plateform after 2015. The current usage metrics is available 48-96 hours after online publication and is updated daily on week days.
Initial download of the metrics may take a while.