Open Access
Fig. 1.
Download original image
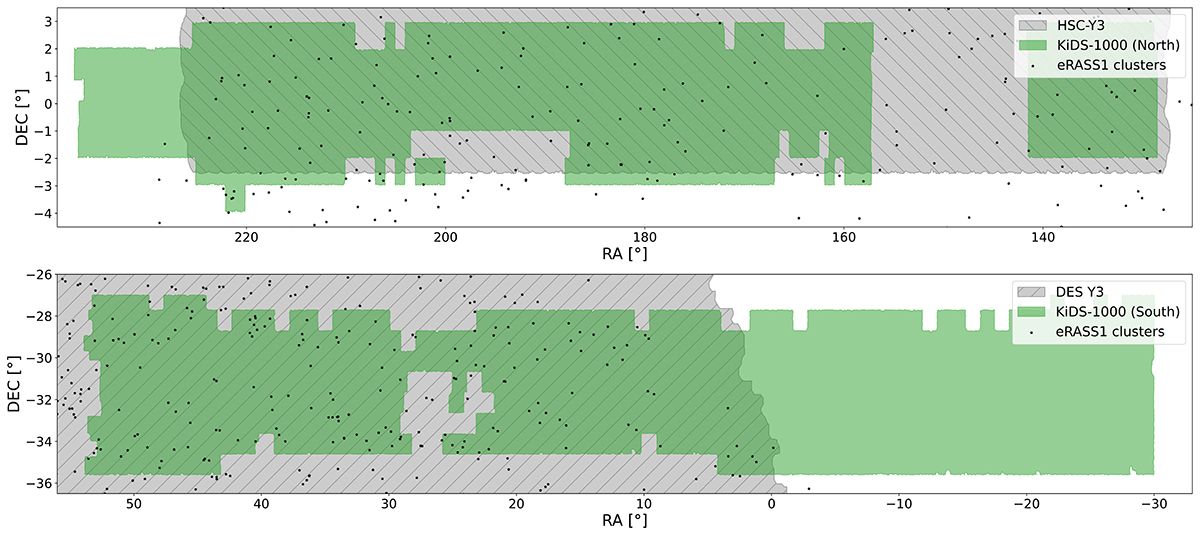
Footprint of KiDS-1000 North (top) and South (bottom) as well as DES Y3 (overlap with KiDS South), HSC S19 (overlap with KiDS North), and the eRASS1 cluster sample.
Current usage metrics show cumulative count of Article Views (full-text article views including HTML views, PDF and ePub downloads, according to the available data) and Abstracts Views on Vision4Press platform.
Data correspond to usage on the plateform after 2015. The current usage metrics is available 48-96 hours after online publication and is updated daily on week days.
Initial download of the metrics may take a while.