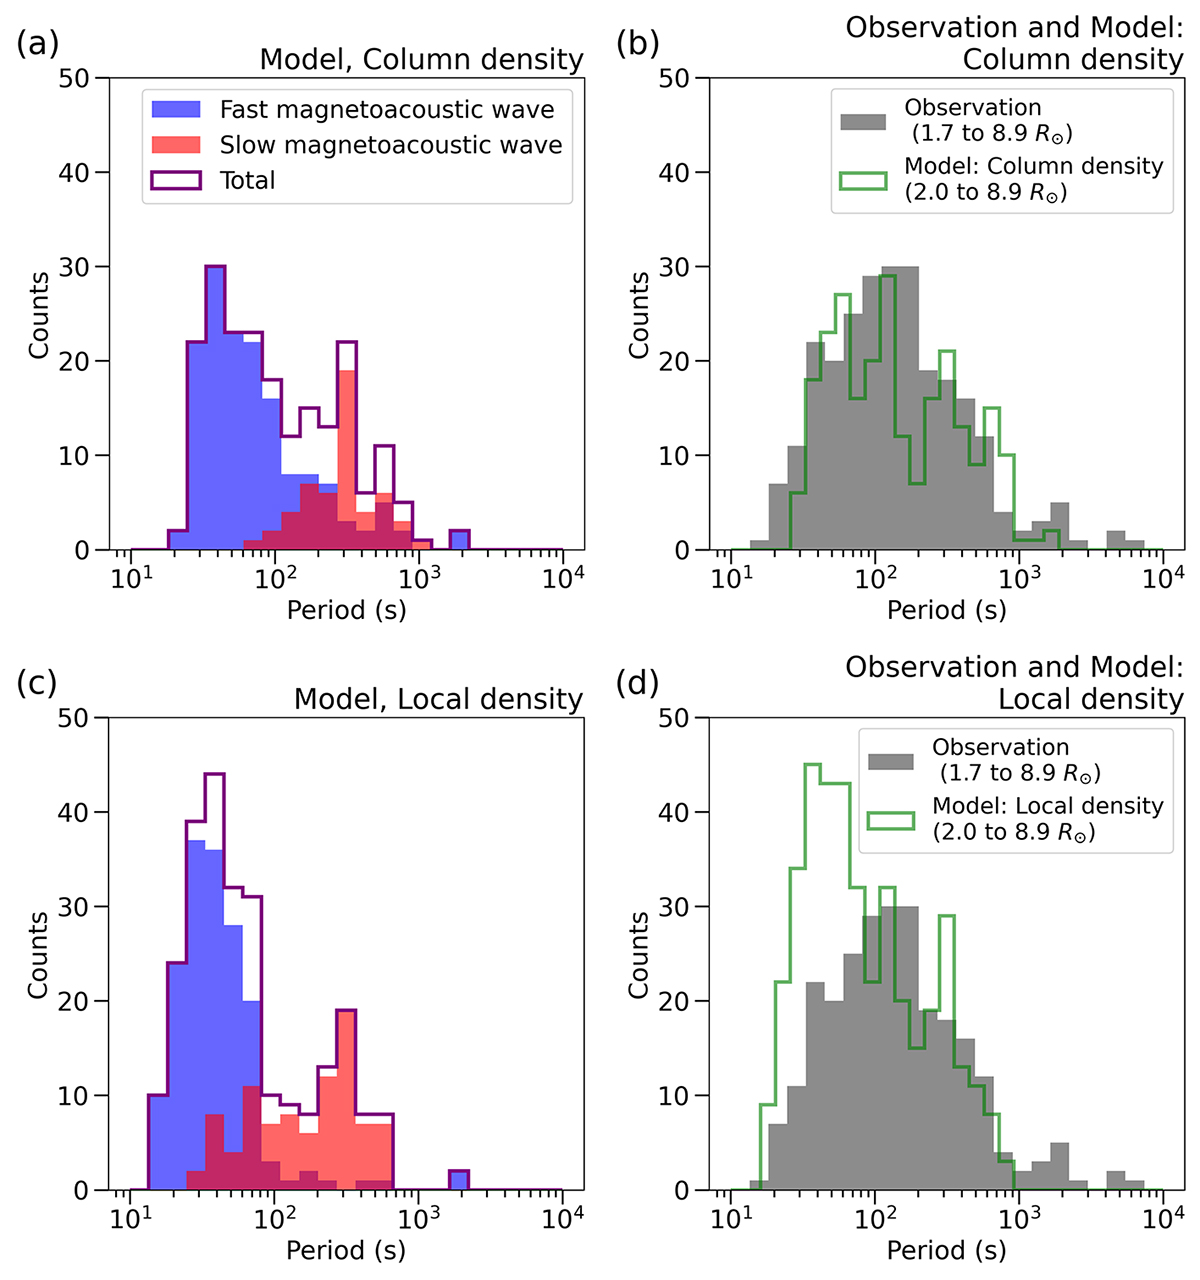
Fig. 8.
Download original image
Histograms of the wave period detected from the decomposed fractional fluctuations of (a) the column density and (c) local density. In panels a and c, the counts for fast magnetoacoustic waves and slow magnetoacoustic waves are shown separately in addition to the total counts. Panels b, d: Comparison of the period histogram of the density fluctuations detected from the observations and the entire time series of the model. Panels b and d used the column density fluctuations and the local density fluctuations as the model data, respectively. In panels b and b, the observations are displayed in gray bins, and the models are shown in green bins. We use the observational data in the heliocentric distance range of 1.7−8.9 R⊙ and the model data in the range of 2.0−8.9 R⊙. The bin size is such that the whole range of 101 − 104 is divided into 30 regular subintervals on a logarithmic scale.
Current usage metrics show cumulative count of Article Views (full-text article views including HTML views, PDF and ePub downloads, according to the available data) and Abstracts Views on Vision4Press platform.
Data correspond to usage on the plateform after 2015. The current usage metrics is available 48-96 hours after online publication and is updated daily on week days.
Initial download of the metrics may take a while.