Fig. 7.
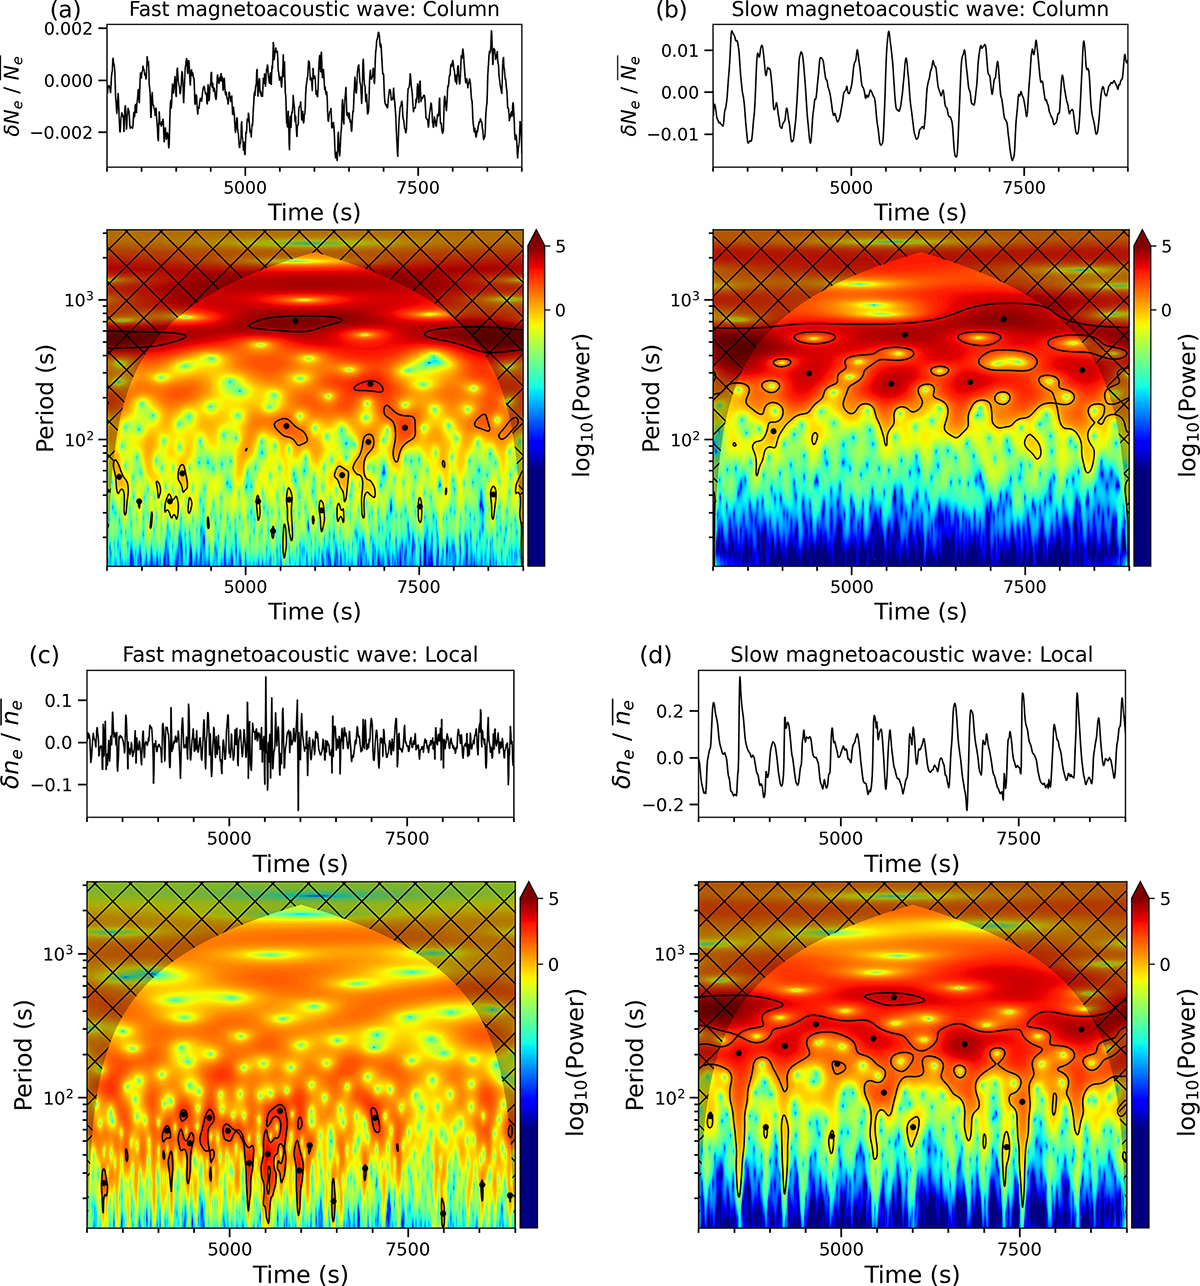
Download original image
Time series of the fractional density perturbation at 6 R⊙ in the model (upper panel in each of a, b, c, d) and its wavelet spectrum (lower panel in each of a, b, c, d), for the (a)/(c) fast and (b)/(d) slow magnetoacoustic waves extracted from the original time series. The wavelet power is normalized by the variance of the time series. The shaded region indicates the COI. The black lines indicate the 95% confidence level. The black points indicate peaks of the wave packets that satisfy the four criteria described in the text. The data in panels a and b are decomposed by the fractional fluctuations of the column density, and the data in panels c and d are decomposed by the fractional fluctuations of the local density.
Current usage metrics show cumulative count of Article Views (full-text article views including HTML views, PDF and ePub downloads, according to the available data) and Abstracts Views on Vision4Press platform.
Data correspond to usage on the plateform after 2015. The current usage metrics is available 48-96 hours after online publication and is updated daily on week days.
Initial download of the metrics may take a while.