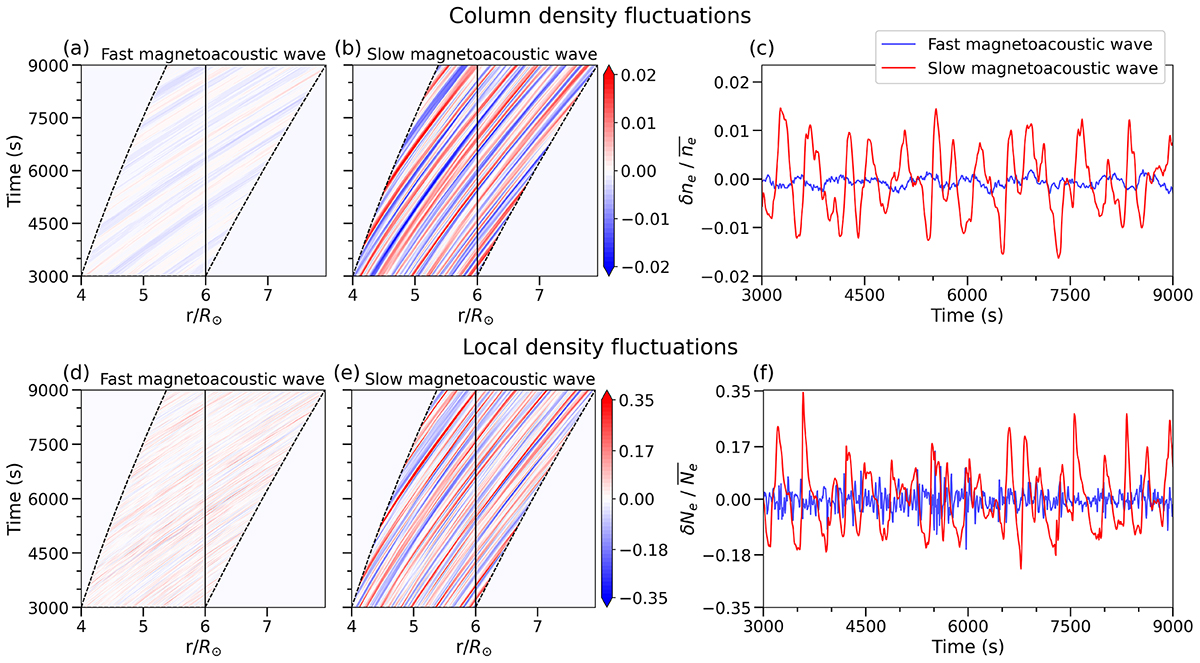
Fig. 6.
Download original image
Filtered r-t diagram for (a), (d) fast magnetoacoustic waves and that for (b), (e) slow magnetoacoustic waves. The region encircled by dashed black lines in panels a/b and d/e correspond to those in Figures 5a and c, respectively. Panels c, f: Time series of the density perturbation at a heliocentric distance of 6 R⊙ filtered to retain fast (blue line) and slow (red line) modes. These time series correspond to the solid lines in panels a and b and are used in the subsequent analysis (Figure 7). The upper panels, a–c, are obtained from the fractional fluctuations of the column density, and the lower panels, d–f, are obtained from those of the local density.
Current usage metrics show cumulative count of Article Views (full-text article views including HTML views, PDF and ePub downloads, according to the available data) and Abstracts Views on Vision4Press platform.
Data correspond to usage on the plateform after 2015. The current usage metrics is available 48-96 hours after online publication and is updated daily on week days.
Initial download of the metrics may take a while.