Fig. 5.
Download original image
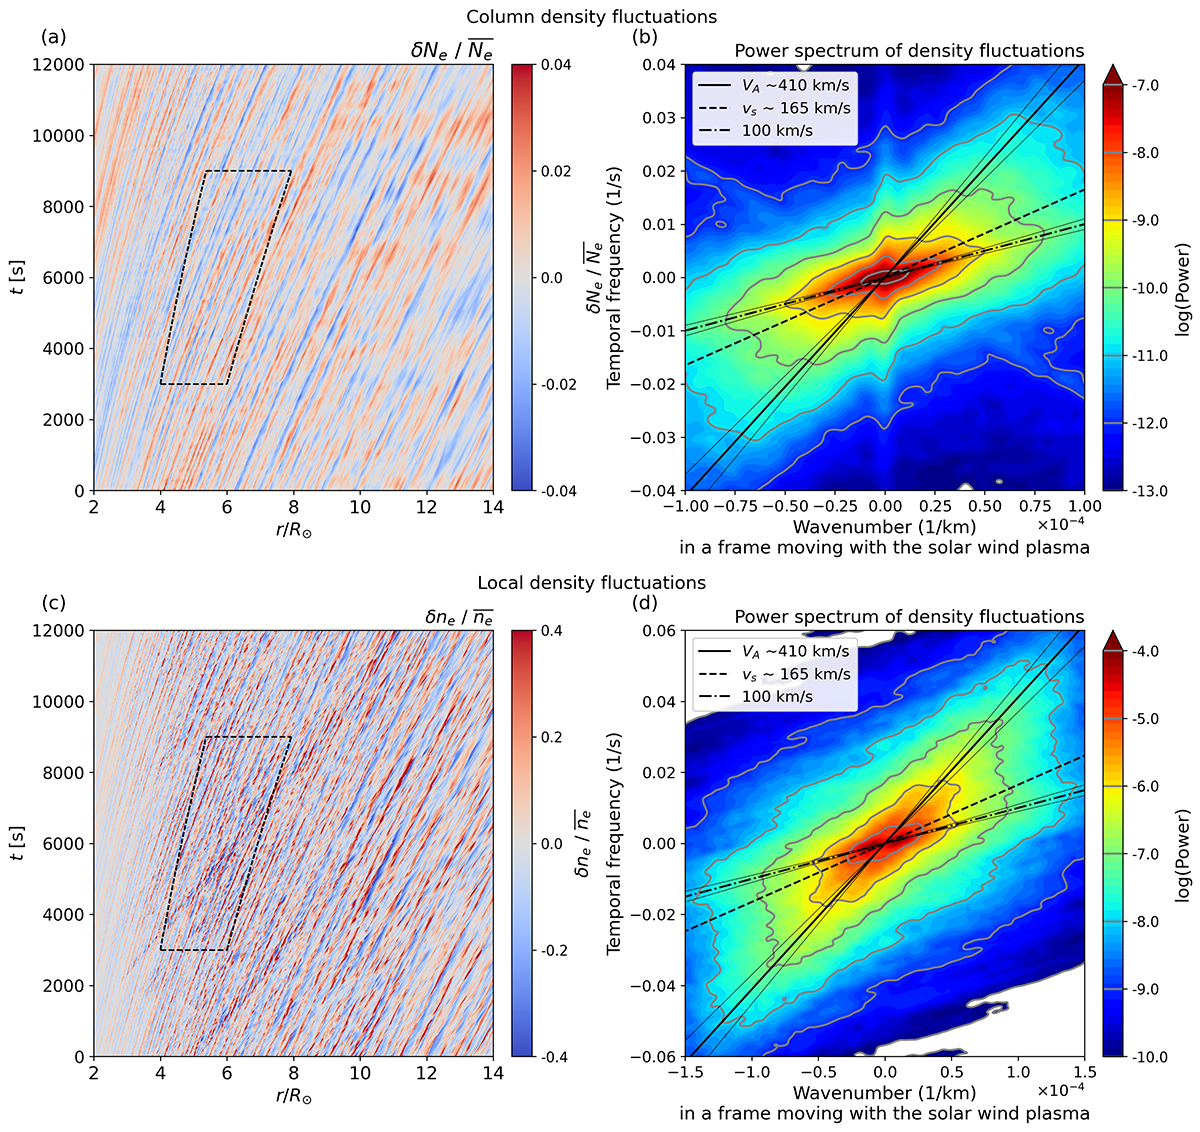
Panels a, c: Distance-time diagram of fractional density fluctuations in column density, ![]() , (upper panel), and local density,
, (upper panel), and local density, ![]() , (lower panel), within the MHD simulation. The area encircled by dashed black lines is designated for subsequent Fourier analysis. Panels b, d: Two-dimensional power spectrum of density fluctuation with respect to wavenumber and frequency. The spectra are calculated in a coordinate system aligned with the background solar wind. Gray lines represent power contours from the FFT spectrum. Thick solid and dashed lines denote nominal Alfvén and sound speeds, respectively, while a dash-dotted line marks 100 km/s. Thin lines outline the phase speed range useful for mode decomposition.
, (lower panel), within the MHD simulation. The area encircled by dashed black lines is designated for subsequent Fourier analysis. Panels b, d: Two-dimensional power spectrum of density fluctuation with respect to wavenumber and frequency. The spectra are calculated in a coordinate system aligned with the background solar wind. Gray lines represent power contours from the FFT spectrum. Thick solid and dashed lines denote nominal Alfvén and sound speeds, respectively, while a dash-dotted line marks 100 km/s. Thin lines outline the phase speed range useful for mode decomposition.
Current usage metrics show cumulative count of Article Views (full-text article views including HTML views, PDF and ePub downloads, according to the available data) and Abstracts Views on Vision4Press platform.
Data correspond to usage on the plateform after 2015. The current usage metrics is available 48-96 hours after online publication and is updated daily on week days.
Initial download of the metrics may take a while.