Fig. 3.
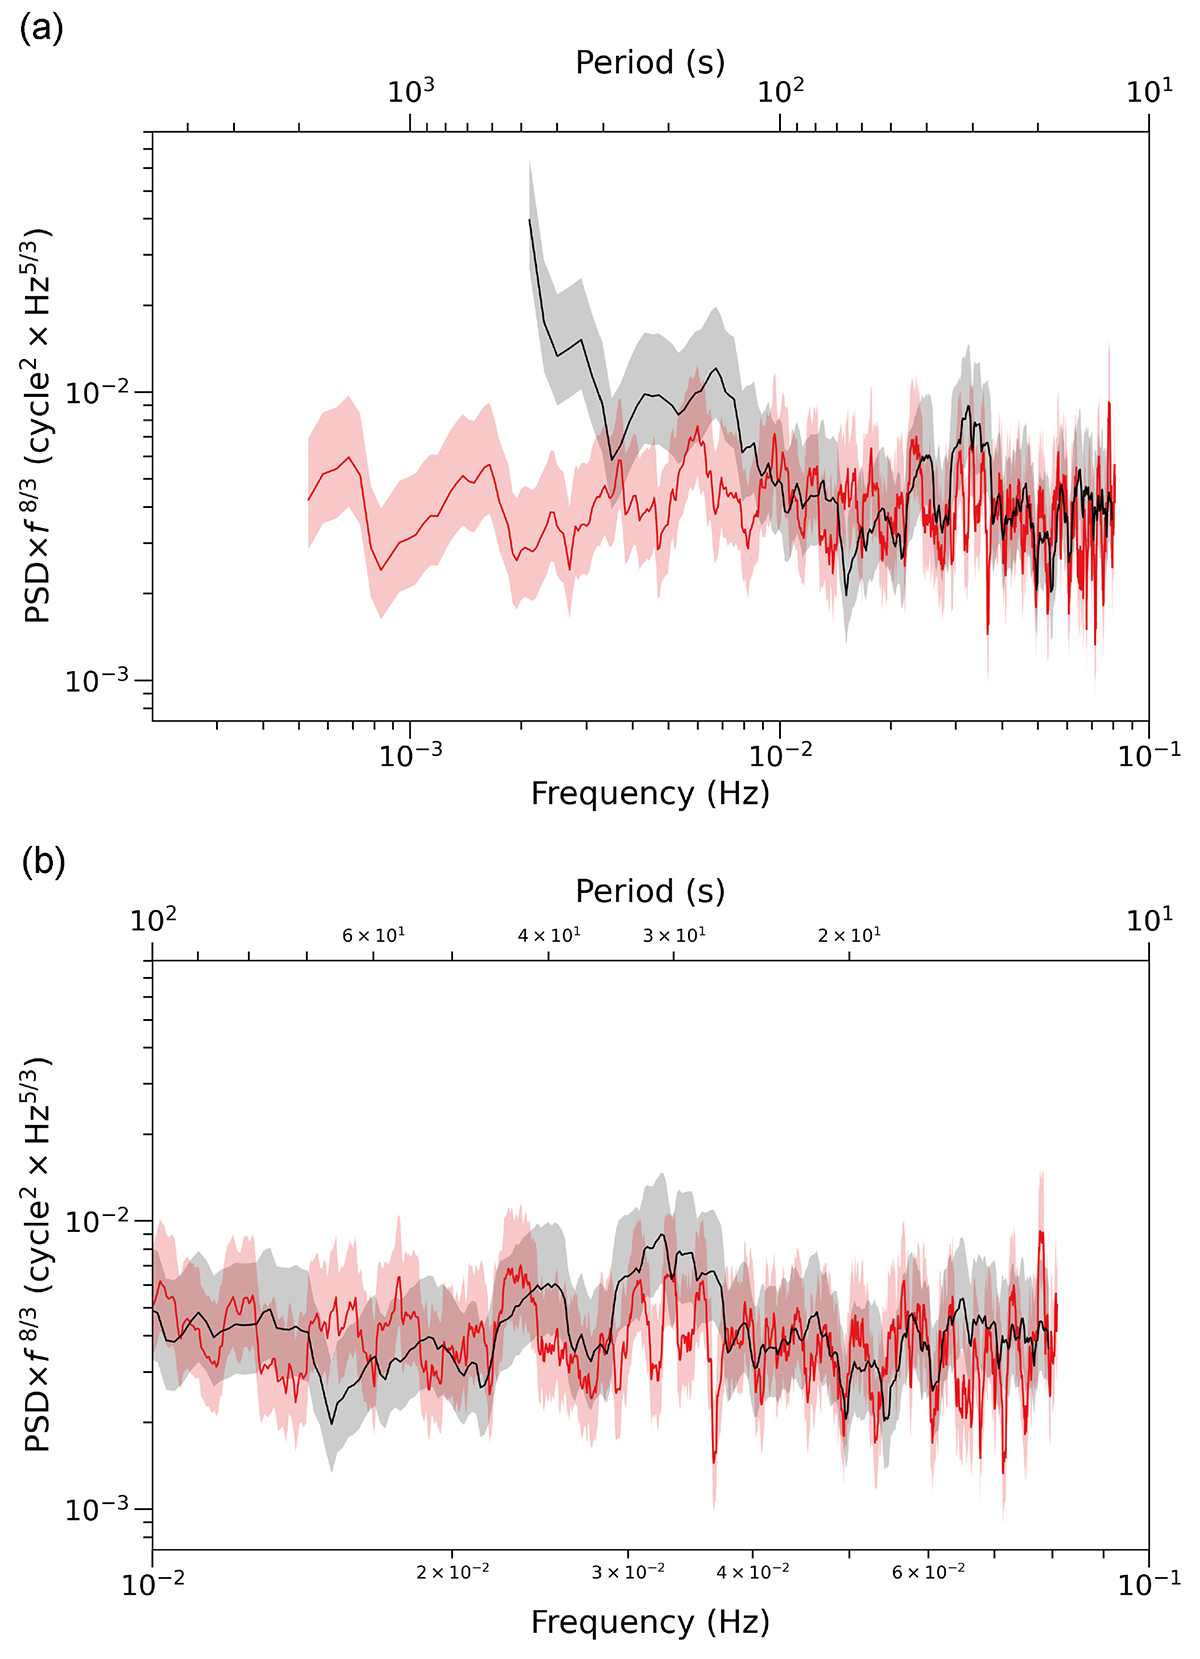
Download original image
(a) Normalized power spectrum of the phase time series data. Red line shows the power spectrum applied to the whole phase time series data of the received signal, and black line shows that the spectrum applied to a part of the time series corresponding to the gray region in the upper panel of Figure 2. The power spectrum is normalized by multiplying f8/3. The 95% confidence interval of the chi-squared distribution is overplotted as the error bar for each spectrum. Panel b provides an enlarged view of the spectrum shown in panel a for the frequency range of 10−2 − 10−1 Hz.
Current usage metrics show cumulative count of Article Views (full-text article views including HTML views, PDF and ePub downloads, according to the available data) and Abstracts Views on Vision4Press platform.
Data correspond to usage on the plateform after 2015. The current usage metrics is available 48-96 hours after online publication and is updated daily on week days.
Initial download of the metrics may take a while.