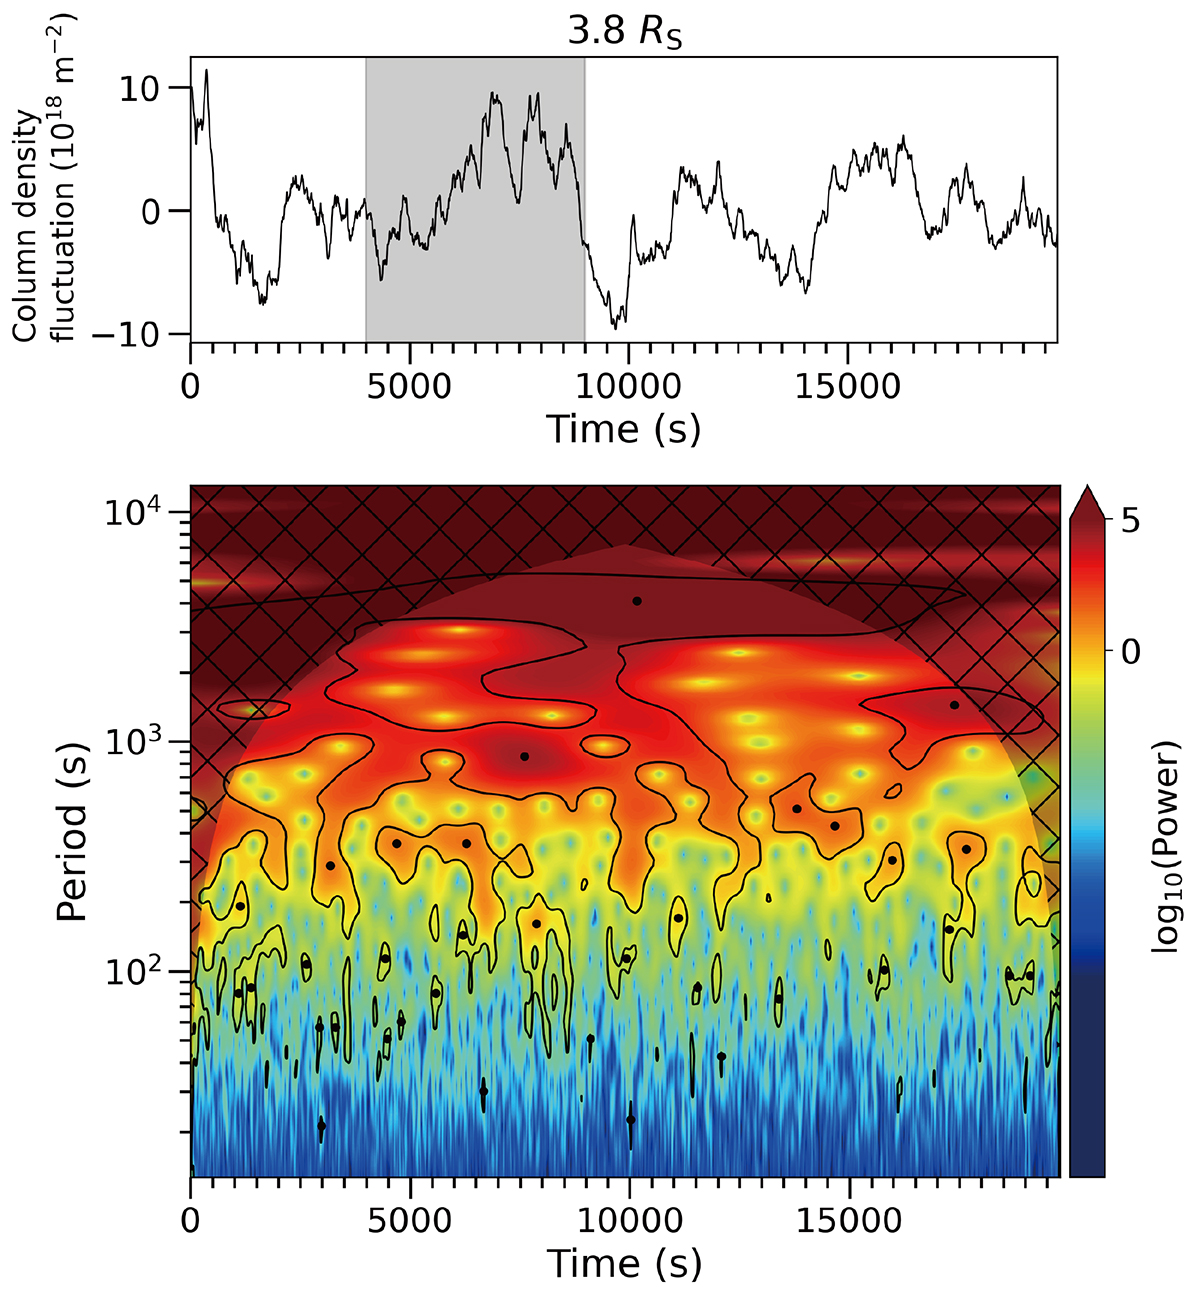
Fig. 2.
Download original image
Example of (upper) the time series of the electron column density fluctuation and (lower) its wavelet spectrum. The data was obtained on June 3, 2016, at a heliocentric distance of 3.8 R⊙. The wavelet power is normalized by the variance of the time series. The shaded region in the lower panel is the cone of influence (COI), which is the region where the effect of the discontinuity at the edge of the time series becomes significant. The black lines indicate the 95% confident level. The black points indicate peaks of the wave packets that satisfy the four criteria described in the text.
Current usage metrics show cumulative count of Article Views (full-text article views including HTML views, PDF and ePub downloads, according to the available data) and Abstracts Views on Vision4Press platform.
Data correspond to usage on the plateform after 2015. The current usage metrics is available 48-96 hours after online publication and is updated daily on week days.
Initial download of the metrics may take a while.