Fig. 10.
Download original image
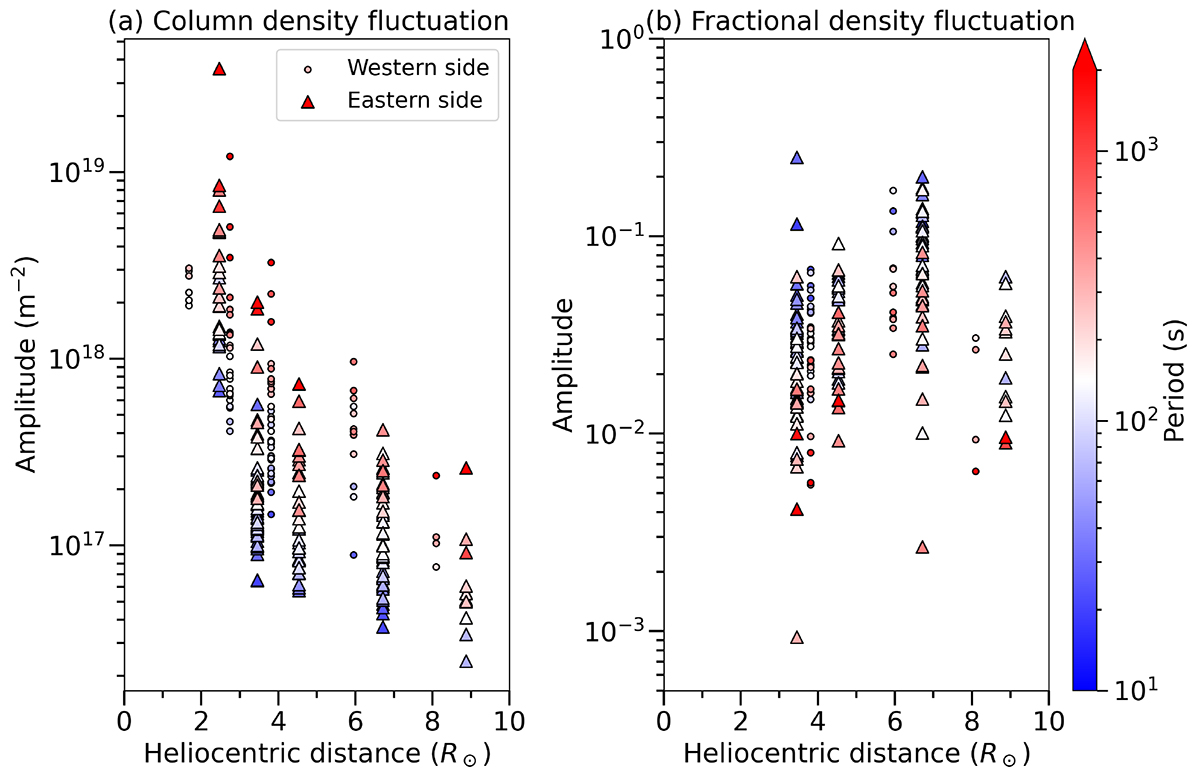
Radial distributions of the amplitude of the detected wave packets obtained from the observations. Panel a shows the amplitude of the electron column density fluctuation, Ne′, and panel b shows that of the fractional density fluctuation. Circles show observations on the western side of the Sun and triangles show observations on the eastern side. The color represents the period of each wave packet.
Current usage metrics show cumulative count of Article Views (full-text article views including HTML views, PDF and ePub downloads, according to the available data) and Abstracts Views on Vision4Press platform.
Data correspond to usage on the plateform after 2015. The current usage metrics is available 48-96 hours after online publication and is updated daily on week days.
Initial download of the metrics may take a while.