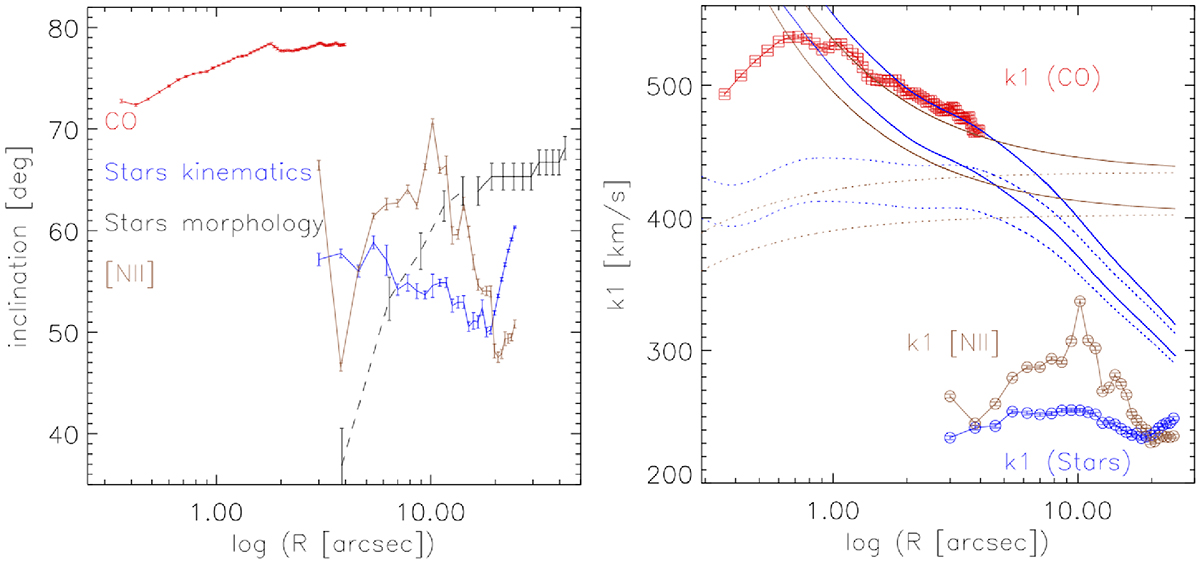
Fig. 8.
Download original image
Results from Kinemetry. Left: Best-fit kinematic inclination as a function of nuclear distance obtained by Kinemetry on the CO (red), [N II] λ6583 (brown), and stellar (blue) velocity fields, with the PA fixed to 355°. For reference, the equivalent (morphology) results from running Kinemetry on the HST/WFC3 F160W image are shown in black; at radii ≤15″ these latter fits are not reliable, due to the prominent dust lanes, and are shown with a dotted black line. Error bars are as reported by Kinemetry. Right: Kinemetry-derived k1 coefficient (the – projected for inclination – amplitude of the “pure-rotative” component k1 cos θ) as a function of radius when fitting the velocity fields of CO (red symbols), [N II] λ6583 (brown symbols) and stars (blue symbols). Error bars shown are as reported by Kinemetry. Overlaid (see Sect. 4) are the adopted best fit inclination-projected rotation curves due to the stellar potential for the arctangent (brown dotted lines) and the MGEFit solution (blue dotted lines): two curves (inclinations of 78° and 65°) are shown for each. The solid lines in the corresponding colors show the total expected inclination-projected rotation curve if our adopted best-fit value (3.34 × 10⁹ M⊙) for the black hole mass is considered.
Current usage metrics show cumulative count of Article Views (full-text article views including HTML views, PDF and ePub downloads, according to the available data) and Abstracts Views on Vision4Press platform.
Data correspond to usage on the plateform after 2015. The current usage metrics is available 48-96 hours after online publication and is updated daily on week days.
Initial download of the metrics may take a while.