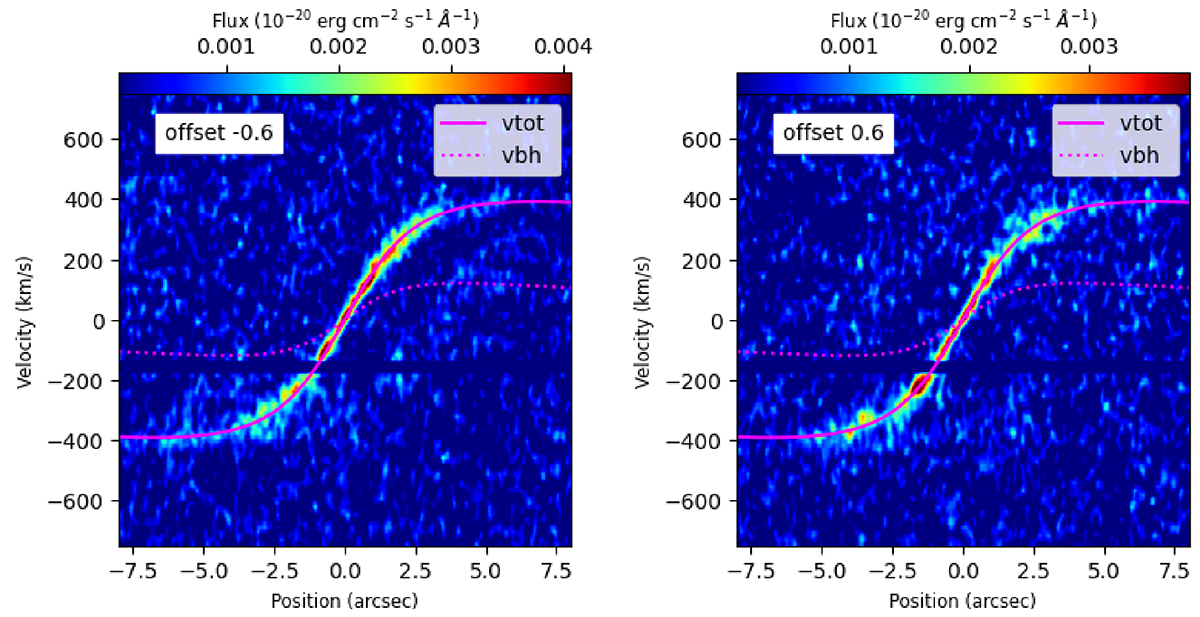
Fig. 7.
Download original image
Same as Fig. 5, but with the position-velocity diagrams of the CO emission line set along slits parallel to (but offset from) the major axis (PA 355°) of the galaxy. Left to right: Offset by −0![]() (i.e., to the east) and
(i.e., to the east) and ![]() (i.e., to the west). The overplotted model uses an inclination of 78°; the black hole only (vbh) and total (vtot; galaxy plus black hole) rotational predictions are plotted in both panels.
(i.e., to the west). The overplotted model uses an inclination of 78°; the black hole only (vbh) and total (vtot; galaxy plus black hole) rotational predictions are plotted in both panels.
Current usage metrics show cumulative count of Article Views (full-text article views including HTML views, PDF and ePub downloads, according to the available data) and Abstracts Views on Vision4Press platform.
Data correspond to usage on the plateform after 2015. The current usage metrics is available 48-96 hours after online publication and is updated daily on week days.
Initial download of the metrics may take a while.