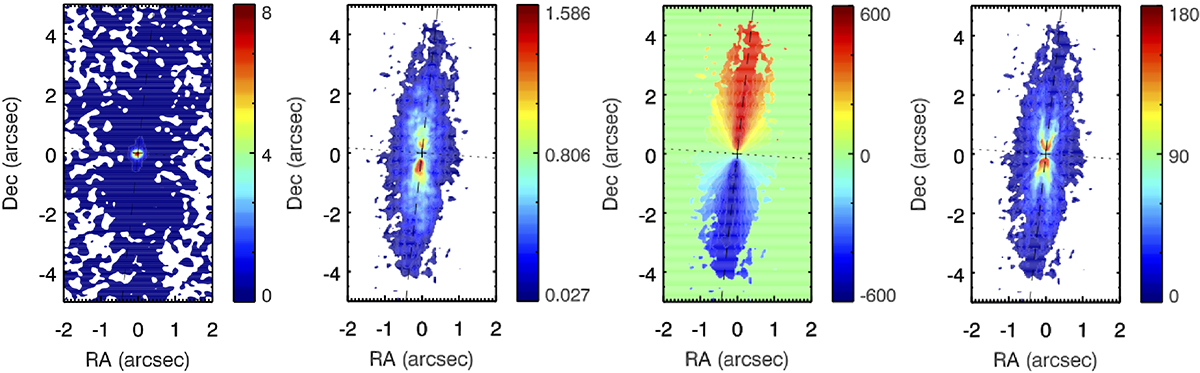
Fig. 6.
Download original image
Maps of the 345 GHz continuum (mJy), and the CO J:3−2 emission line moment 0 (flux; Jy km s−1), moment 1 (velocity; km s−1), and moment 2 (velocity dispersion; km s−1) in NGC 4751. All panels follow the color bar on their right and share the same center and FOV. The “zero” velocity corresponds to 2130 km/s and the cross marks the position of the continuum peak. While most of the CO emission was detected inside the FOV shown here, a few isolated clumps are detected up to 7″ from the nucleus.
Current usage metrics show cumulative count of Article Views (full-text article views including HTML views, PDF and ePub downloads, according to the available data) and Abstracts Views on Vision4Press platform.
Data correspond to usage on the plateform after 2015. The current usage metrics is available 48-96 hours after online publication and is updated daily on week days.
Initial download of the metrics may take a while.