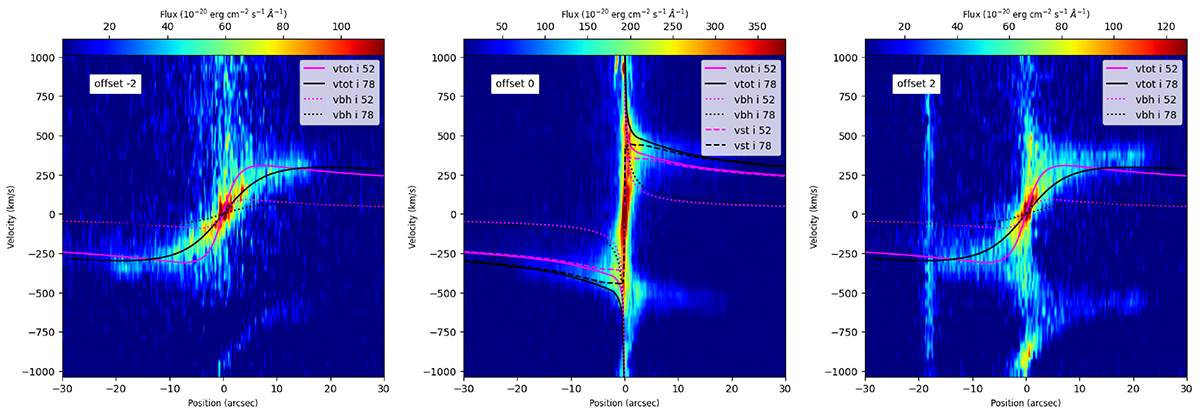
Fig. 5.
Download original image
Position-velocity diagrams of the [N II] λ6583 emission line along slits parallel to (but offset from) the major axis of the galaxy. Left to right: Offset by −2″ (i.e., to the east), 0″ (i.e., nuclear), and 2″ (i.e., to the west), from the nuclear position. Offsets along the slits (x axis) are measured from the intersection point of the slit with the minor axis of the galaxy; positive offsets are to the N side of the galaxy. Models overplotted in magenta and black follow the inclination listed in the legend; they have the black hole mass and M/L of our adopted best fit model (see Sect. 4). The black hole only (vbh) and total (vtot; galaxy plus black hole) radial velocity predictions are plotted in all panels; the galaxy prediction (vst) is plotted only in the central panel.
Current usage metrics show cumulative count of Article Views (full-text article views including HTML views, PDF and ePub downloads, according to the available data) and Abstracts Views on Vision4Press platform.
Data correspond to usage on the plateform after 2015. The current usage metrics is available 48-96 hours after online publication and is updated daily on week days.
Initial download of the metrics may take a while.