Fig. 4.
Download original image
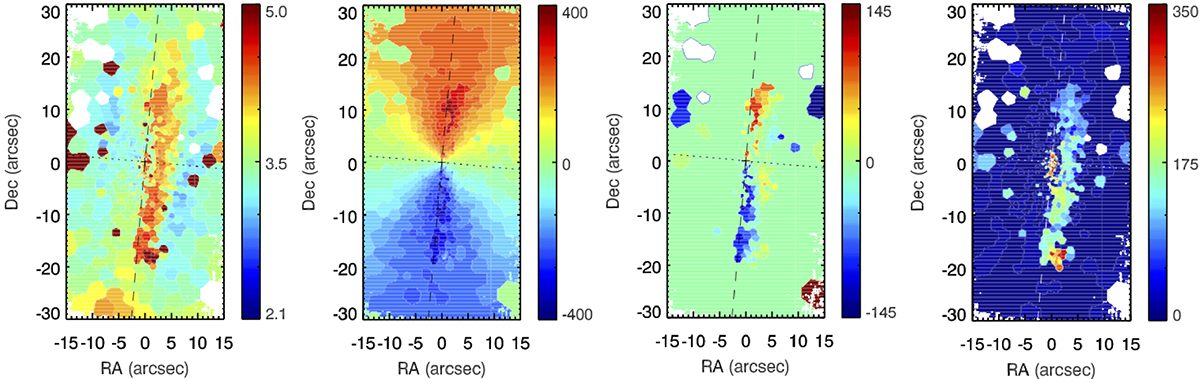
[N II] λ6583 emission line properties derived using GANDALF (within the GIST Pipeline) on the MUSE datacube. Left to right: Maps of the [N II] log intensity, velocity, velocity residual (after subtracting the stellar velocity field), and dispersion velocity. The nuclear position and the major and minor axes are marked in each panel.
Current usage metrics show cumulative count of Article Views (full-text article views including HTML views, PDF and ePub downloads, according to the available data) and Abstracts Views on Vision4Press platform.
Data correspond to usage on the plateform after 2015. The current usage metrics is available 48-96 hours after online publication and is updated daily on week days.
Initial download of the metrics may take a while.