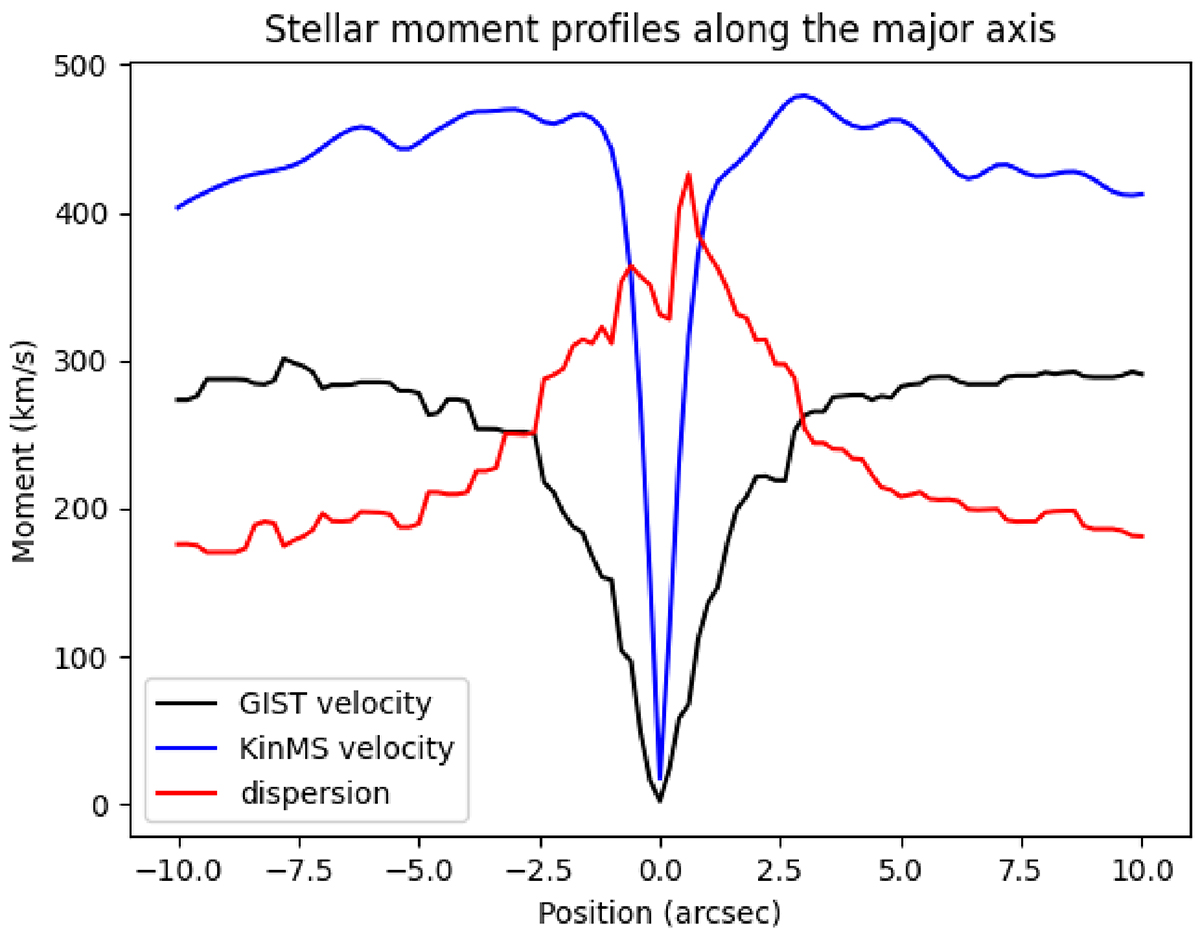
Fig. 17.
Download original image
Comparison of observed and expected stellar velocities, and the stellar velocity dispersion, along the major axis of NGC 4751. The blue line shows the predicted circular velocity extracted from a KinMS model built using of parameters of our adopted result (see text for the details). The black line shows the (deprojected for an inclination of 66°) velocity of the stars, and the red line the velocity dispersion of the stars.
Current usage metrics show cumulative count of Article Views (full-text article views including HTML views, PDF and ePub downloads, according to the available data) and Abstracts Views on Vision4Press platform.
Data correspond to usage on the plateform after 2015. The current usage metrics is available 48-96 hours after online publication and is updated daily on week days.
Initial download of the metrics may take a while.