Fig. 12.
Download original image
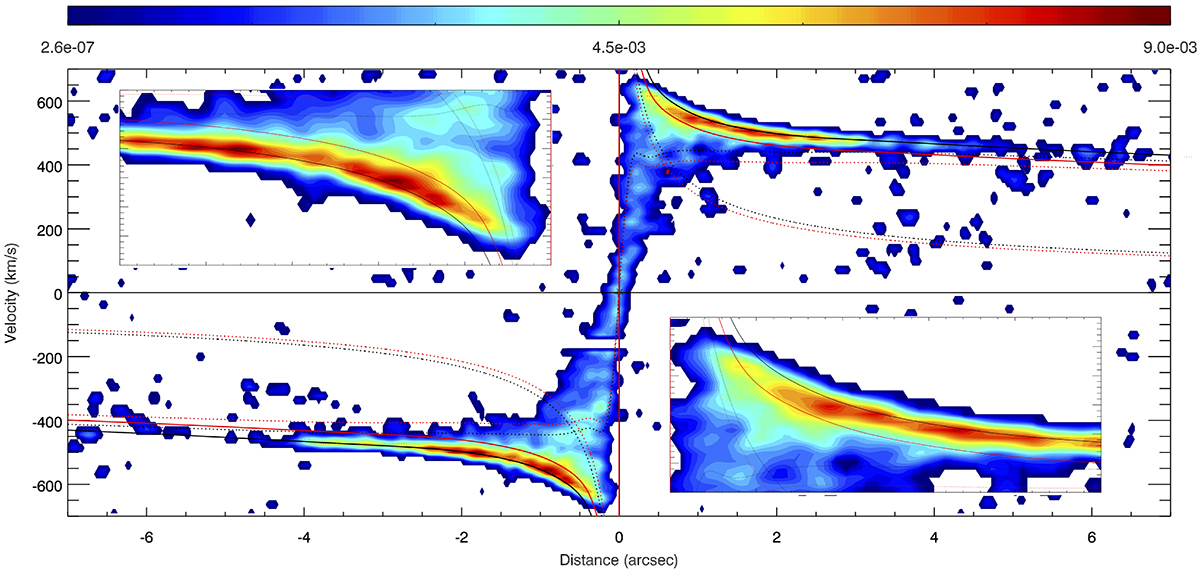
PV diagram along the kinematic major (PA = 355°) of the molecular disk. The observed data are shown in color, following the color bar above the panel (units of Jy/beam), and small black dots in the panel mark the velocity channel in which the profile reaches maximum intensity for each x axis value. The star marks the position of the 345 GHz continuum. The inserts in the major axis pv diagram show zooms of the pv diagram for the innermost redshifted and blueshifted disk. Overplotted are our adopted best fit model: dashed lines show the predicted velocities for the galaxy potential and SMBH individually, while the solid lines shows the prediction combining both of the above. Black (red) is used for a disk inclination of 78° (65°). Note that the model traces the upper velocity envelope of the data at smaller radii; given the high inclination of the disk, the observed major axis “slit” samples other PAs (with lower projected velocities) in the inner arcseconds, underlining the need to use a software like KinMS for the best fit.
Current usage metrics show cumulative count of Article Views (full-text article views including HTML views, PDF and ePub downloads, according to the available data) and Abstracts Views on Vision4Press platform.
Data correspond to usage on the plateform after 2015. The current usage metrics is available 48-96 hours after online publication and is updated daily on week days.
Initial download of the metrics may take a while.