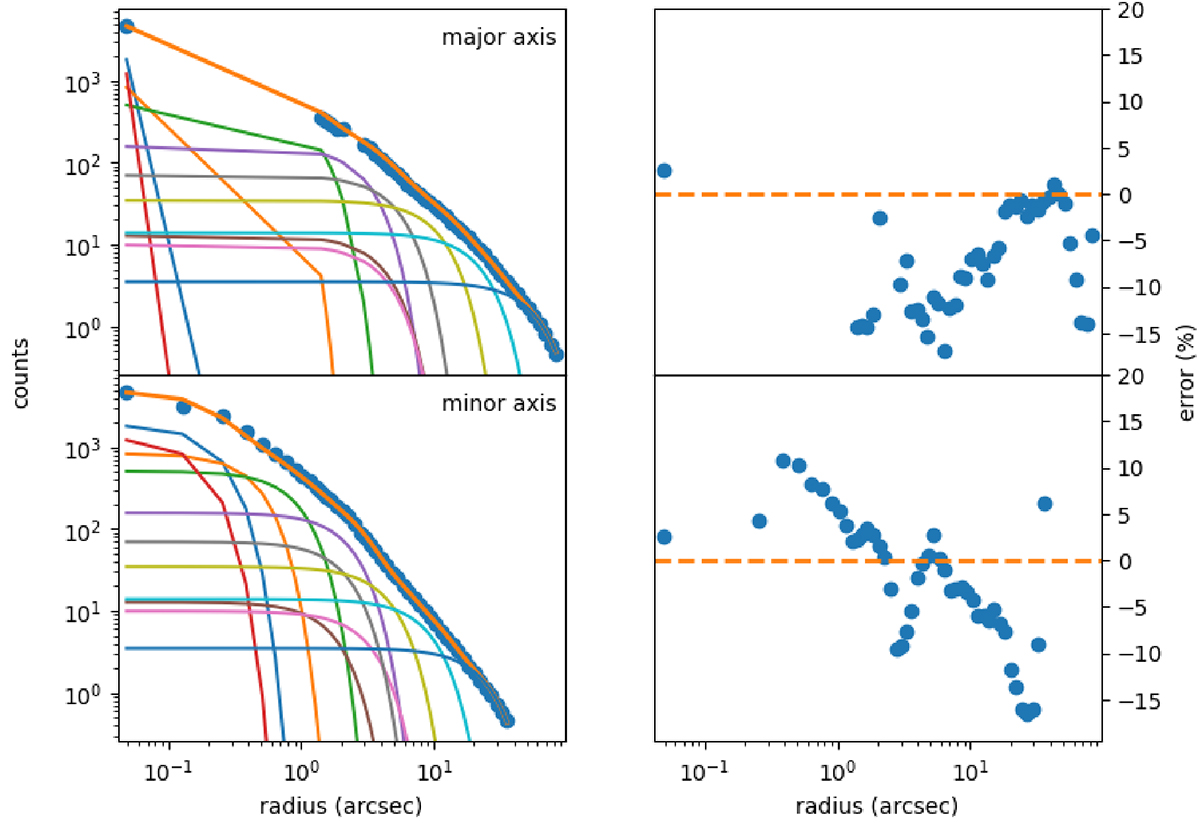
Fig. 11.
Download original image
Example results of the (3D) multi-Gaussian fit to the HST/WFC3 F160W image. Here we show results for the original F160W image with its dust mask applied (central panel in Fig. 10). Left panels: Binned counts (blue filled circles) along the disk major (top) and minor (bottom) axes, the best fit summed profile (highest orange line), and the individual Gaussian profiles which feed into this sum (lines of various colors). Right panels: Corresponding percentage errors between counts and the best fit profile.
Current usage metrics show cumulative count of Article Views (full-text article views including HTML views, PDF and ePub downloads, according to the available data) and Abstracts Views on Vision4Press platform.
Data correspond to usage on the plateform after 2015. The current usage metrics is available 48-96 hours after online publication and is updated daily on week days.
Initial download of the metrics may take a while.