| Issue |
A&A
Volume 694, February 2025
|
|
|---|---|---|
| Article Number | C5 | |
| Number of page(s) | 2 | |
| Section | Astrophysical processes | |
| DOI | https://doi.org/10.1051/0004-6361/202553939e | |
| Published online | 13 February 2025 | |
The properties of magnetised cold filaments in a cool-core galaxy cluster (Corrigendum)
1
Universität Hamburg, Hamburger Sternwarte, Gojenbergsweg 112, 21029 Hamburg, Germany
2
Department of Computational Mathematics, Science, and Engineering, Michigan State University, East Lansing, MI 48824, USA
3
Department of Physics and Astronomy, Michigan State University, East Lansing, MI 48824, USA
4
Facility for Rare Isotope Beams, Michigan State University, East Lansing, MI 48824, USA
⋆ Corresponding author; This email address is being protected from spambots. You need JavaScript enabled to view it.
Key words: errata, addenda / galaxies: clusters: intracluster medium / galaxies: jets / galaxies: magnetic fields / large-scale structure of Universe
We discovered that the central panel of Fig. 6 and the lower left panel of Fig. 13, which present the statistics of cold clumps, were incorrectly labelled as differential mass functions, dN/dMclumps. They actually show normalized histograms of the raw number of clumps per bin.
This changes one of our conclusions: the original clump mass distributions presented in these three figures were reported to follow a power law with an index of around −0.6. When including the differentiation with respect to clump mass, the index of the power law is decreased by −1. Consequently, the differential mass function dN/dMclumps of our clump population follows a power law with an index of around −1.6.
This brings our results much more in line with the literature since numerous simulation–based studies have previously reported that clump mass distributions are well fitted by power laws with indices close to −2 (Li & Bryan 2014; Gronke et al. 2022; Das & Gronke 2024; Ramesh & Nelson 2024; Augustin et al. 2025, e.g.).
The same label issue has crept into the magnetic field clump statistics, shown in Fig. 7 and the lower right panel of Fig. 13, but with no impact on the existing text or our conclusions.
Given that differential distributions are more commonly used in the literature, we present the updated versions of Figs. 6, 7 and 13, shown here as Figs. 1, 2 and 3, respectively.
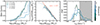 |
Fig. 1. Main statistical properties of the clump sample obtained from the five filaments. The left panel shows the cumulative mass fraction of the clumps as a function of their mass. The distribution of the clumps for the five filaments as a function of their mass and radial velocity are presented in the central and right panel, respectively. The number of clumps for each filament is indicated in the legend of the left panel. The first number indicates the number of clumps included in our statistical analysis, while the number in parentheses indicates the total clump population with no constraint on the minimum number of cells per clump. The associated clump mass distribution with no constraint on the minimum number of cell is also indicated by the dashed bright blue lines. The dashed orange line indicates a dN/dM power law distribution of index α = −1.6 for comparison. The shaded grey area in the top right plot corresponds to the region of positive radial velocity (i.e. clumps flowing out from the cluster centre). |
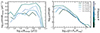 |
Fig. 2. Distribution of the clumps as a function of their volume-weighted magnetic field strength (left panel) and their thermal-to-magnetic pressure ratio, β (right panel), for the five filaments. |
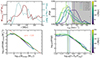 |
Fig. 3. Evolution of the properties of filament system 2 at five equally spaced times. Top left panel: Evolution of the total cold mass budget of the system (solid line) and position of the centre-of-mass of the system (dashed line) as a function of time. Top right panel: Distribution of the radial velocity for various times, along with their associated median values (dashed line). The shaded grey area represents the positive radial velocity region. Lower left panel: Mass distribution of the clumps at various times. Lower right panel: Distribution of the plasma, β, at various times and associated median values (dashed line). The number, N, in the top right panel indicates the number of clumps found at each time, with and without (in parentheses) the constraint on the minimum number of cells (ten) for a clump to be included in the sample. |
References
- Augustin, R., Tumlinson, J., Peeples, M. S., et al. 2025, arXiv e-prints [arXiv:2501.06551] [Google Scholar]
- Das, H. K., & Gronke, M. 2024, MNRAS, 527, 991 [Google Scholar]
- Gronke, M., Oh, S. P., Ji, S., & Norman, C. 2022, MNRAS, 511, 859 [NASA ADS] [CrossRef] [Google Scholar]
- Li, Y., & Bryan, G. L. 2014, ApJ, 789, 153 [Google Scholar]
- Ramesh, R., & Nelson, D. 2024, MNRAS, 528, 3320 [NASA ADS] [CrossRef] [Google Scholar]
© The Authors 2025
 Open Access article, published by EDP Sciences, under the terms of the Creative Commons Attribution License (https://creativecommons.org/licenses/by/4.0), which permits unrestricted use, distribution, and reproduction in any medium, provided the original work is properly cited.
This article is published in open access under the Subscribe to Open model. This email address is being protected from spambots. You need JavaScript enabled to view it. to support open access publication.
All Figures
|
Fig. 1. Main statistical properties of the clump sample obtained from the five filaments. The left panel shows the cumulative mass fraction of the clumps as a function of their mass. The distribution of the clumps for the five filaments as a function of their mass and radial velocity are presented in the central and right panel, respectively. The number of clumps for each filament is indicated in the legend of the left panel. The first number indicates the number of clumps included in our statistical analysis, while the number in parentheses indicates the total clump population with no constraint on the minimum number of cells per clump. The associated clump mass distribution with no constraint on the minimum number of cell is also indicated by the dashed bright blue lines. The dashed orange line indicates a dN/dM power law distribution of index α = −1.6 for comparison. The shaded grey area in the top right plot corresponds to the region of positive radial velocity (i.e. clumps flowing out from the cluster centre). |
| In the text | |
|
Fig. 2. Distribution of the clumps as a function of their volume-weighted magnetic field strength (left panel) and their thermal-to-magnetic pressure ratio, β (right panel), for the five filaments. |
| In the text | |
|
Fig. 3. Evolution of the properties of filament system 2 at five equally spaced times. Top left panel: Evolution of the total cold mass budget of the system (solid line) and position of the centre-of-mass of the system (dashed line) as a function of time. Top right panel: Distribution of the radial velocity for various times, along with their associated median values (dashed line). The shaded grey area represents the positive radial velocity region. Lower left panel: Mass distribution of the clumps at various times. Lower right panel: Distribution of the plasma, β, at various times and associated median values (dashed line). The number, N, in the top right panel indicates the number of clumps found at each time, with and without (in parentheses) the constraint on the minimum number of cells (ten) for a clump to be included in the sample. |
| In the text | |
Current usage metrics show cumulative count of Article Views (full-text article views including HTML views, PDF and ePub downloads, according to the available data) and Abstracts Views on Vision4Press platform.
Data correspond to usage on the plateform after 2015. The current usage metrics is available 48-96 hours after online publication and is updated daily on week days.
Initial download of the metrics may take a while.