Fig. 1.
Download original image
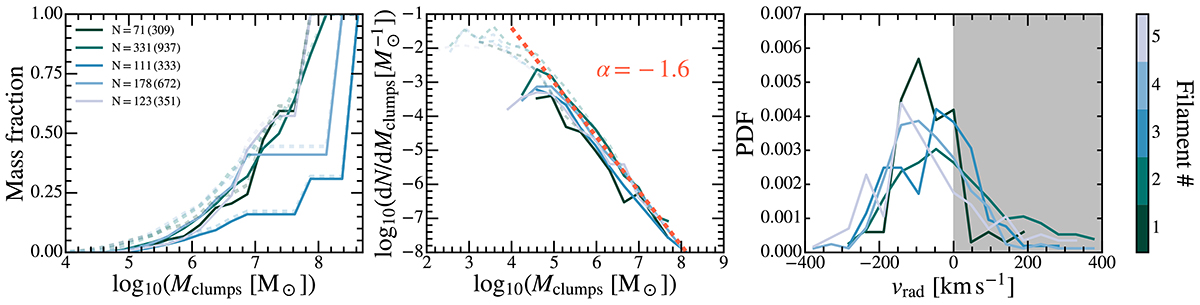
Main statistical properties of the clump sample obtained from the five filaments. The left panel shows the cumulative mass fraction of the clumps as a function of their mass. The distribution of the clumps for the five filaments as a function of their mass and radial velocity are presented in the central and right panel, respectively. The number of clumps for each filament is indicated in the legend of the left panel. The first number indicates the number of clumps included in our statistical analysis, while the number in parentheses indicates the total clump population with no constraint on the minimum number of cells per clump. The associated clump mass distribution with no constraint on the minimum number of cell is also indicated by the dashed bright blue lines. The dashed orange line indicates a dN/dM power law distribution of index α = −1.6 for comparison. The shaded grey area in the top right plot corresponds to the region of positive radial velocity (i.e. clumps flowing out from the cluster centre).
Current usage metrics show cumulative count of Article Views (full-text article views including HTML views, PDF and ePub downloads, according to the available data) and Abstracts Views on Vision4Press platform.
Data correspond to usage on the plateform after 2015. The current usage metrics is available 48-96 hours after online publication and is updated daily on week days.
Initial download of the metrics may take a while.