Fig. 3.
Download original image
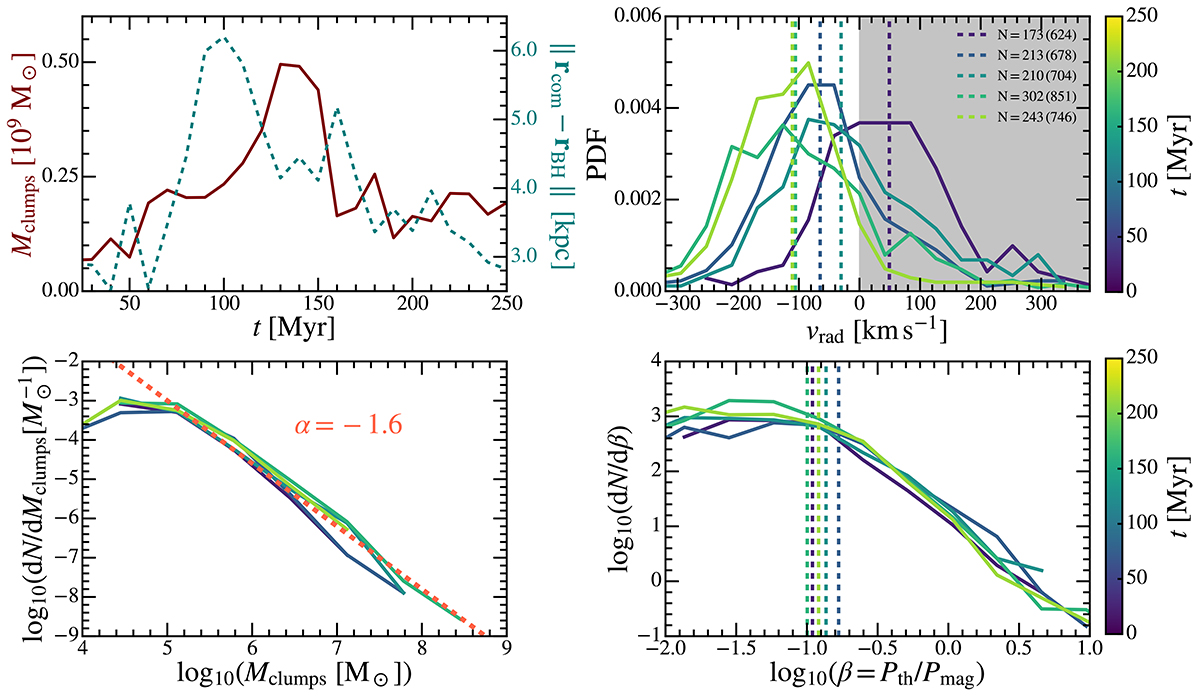
Evolution of the properties of filament system 2 at five equally spaced times. Top left panel: Evolution of the total cold mass budget of the system (solid line) and position of the centre-of-mass of the system (dashed line) as a function of time. Top right panel: Distribution of the radial velocity for various times, along with their associated median values (dashed line). The shaded grey area represents the positive radial velocity region. Lower left panel: Mass distribution of the clumps at various times. Lower right panel: Distribution of the plasma, β, at various times and associated median values (dashed line). The number, N, in the top right panel indicates the number of clumps found at each time, with and without (in parentheses) the constraint on the minimum number of cells (ten) for a clump to be included in the sample.
Current usage metrics show cumulative count of Article Views (full-text article views including HTML views, PDF and ePub downloads, according to the available data) and Abstracts Views on Vision4Press platform.
Data correspond to usage on the plateform after 2015. The current usage metrics is available 48-96 hours after online publication and is updated daily on week days.
Initial download of the metrics may take a while.