Fig. 7
Download original image
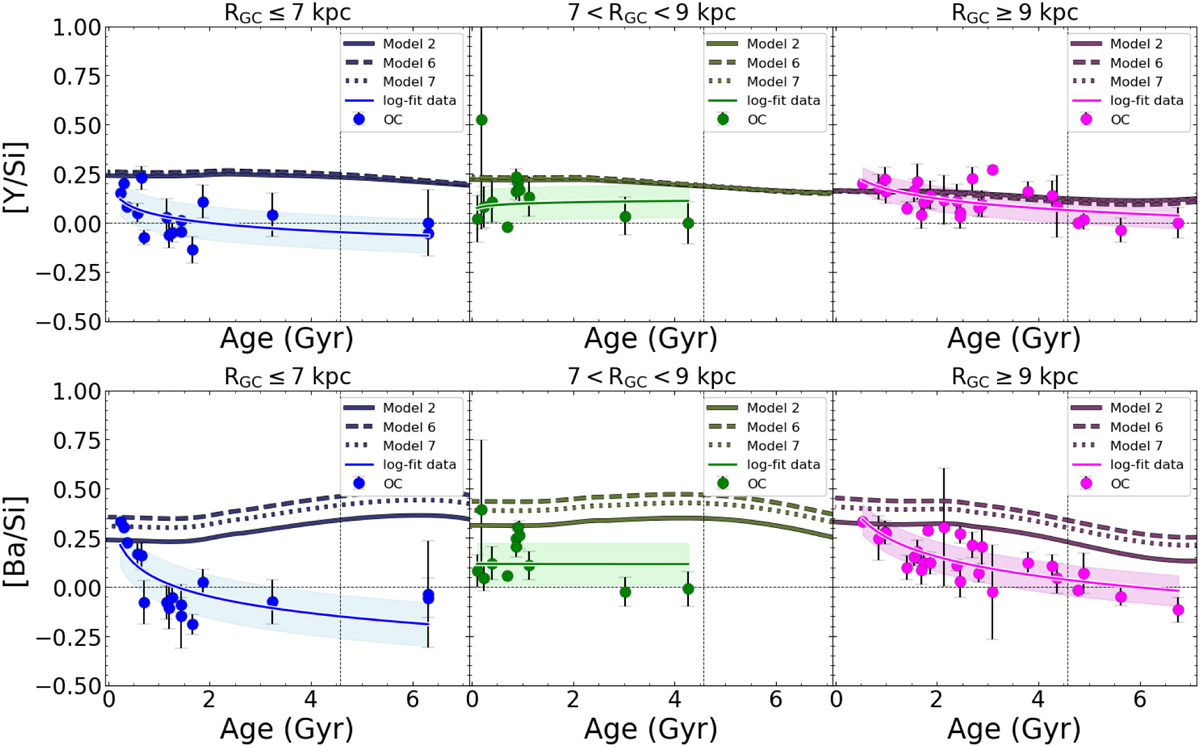
[s/Si] versus age observed trends for Y (upper panel) and Ba (lower panel) divided in the three Galactocentric regions of interested. The logarithmic fits of the OC samples in the three regions are shown as blue (inner region), green (solar region) and magenta (outer region) curves. Predictions of the chemical evolution model in the case of a two- (dashed lines) and of a three-infall (solid lines) scenario are compared to the OC sample. Predictions of the chemical evolution model in the case of different assumptions concerning the production of s-process material from massive stars are compared to the OC sample. See Table 3 for reference.
Current usage metrics show cumulative count of Article Views (full-text article views including HTML views, PDF and ePub downloads, according to the available data) and Abstracts Views on Vision4Press platform.
Data correspond to usage on the plateform after 2015. The current usage metrics is available 48-96 hours after online publication and is updated daily on week days.
Initial download of the metrics may take a while.