Fig. 2
Download original image
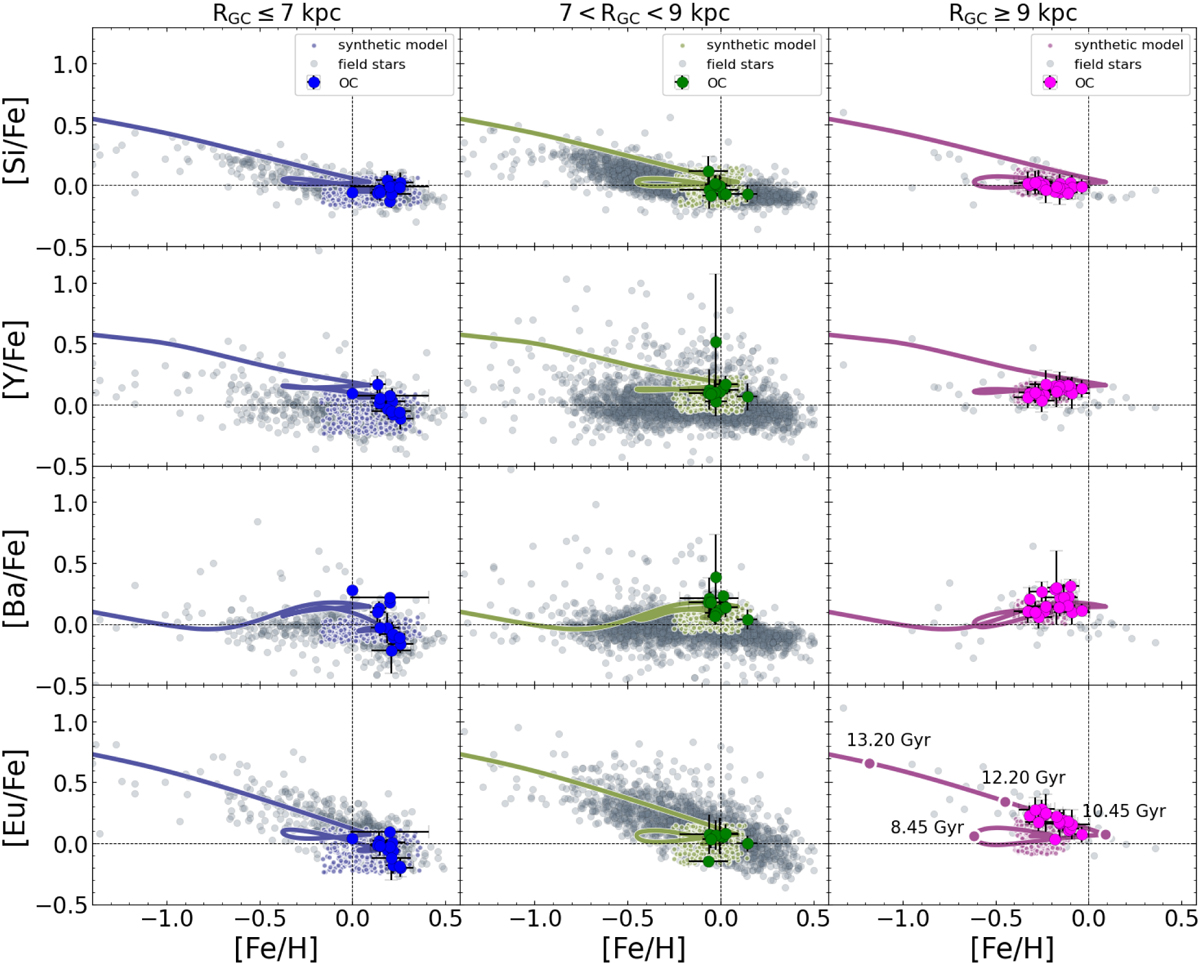
[X/Fe] versus [Fe/H] abundance patterns for Si, Y, Ba, and Eu as predicted by the three-infall model at RGC = 6, 8, 12 kpc compared to the sample of OCs (colored dots) and field (grey dots) stars in the inner, solar, and outer regions, respectively. Results of the synthetic model, as well as OCs, are plotted only for Age ≤3 Gyr. In the lower right panel, for the prediction of the [Eu/Fe] versus [Fe/H] in the outer regions, the filled magenta circles indicate the [Eu/Fe] at a given age.
Current usage metrics show cumulative count of Article Views (full-text article views including HTML views, PDF and ePub downloads, according to the available data) and Abstracts Views on Vision4Press platform.
Data correspond to usage on the plateform after 2015. The current usage metrics is available 48-96 hours after online publication and is updated daily on week days.
Initial download of the metrics may take a while.