Fig. B.1.
Download original image
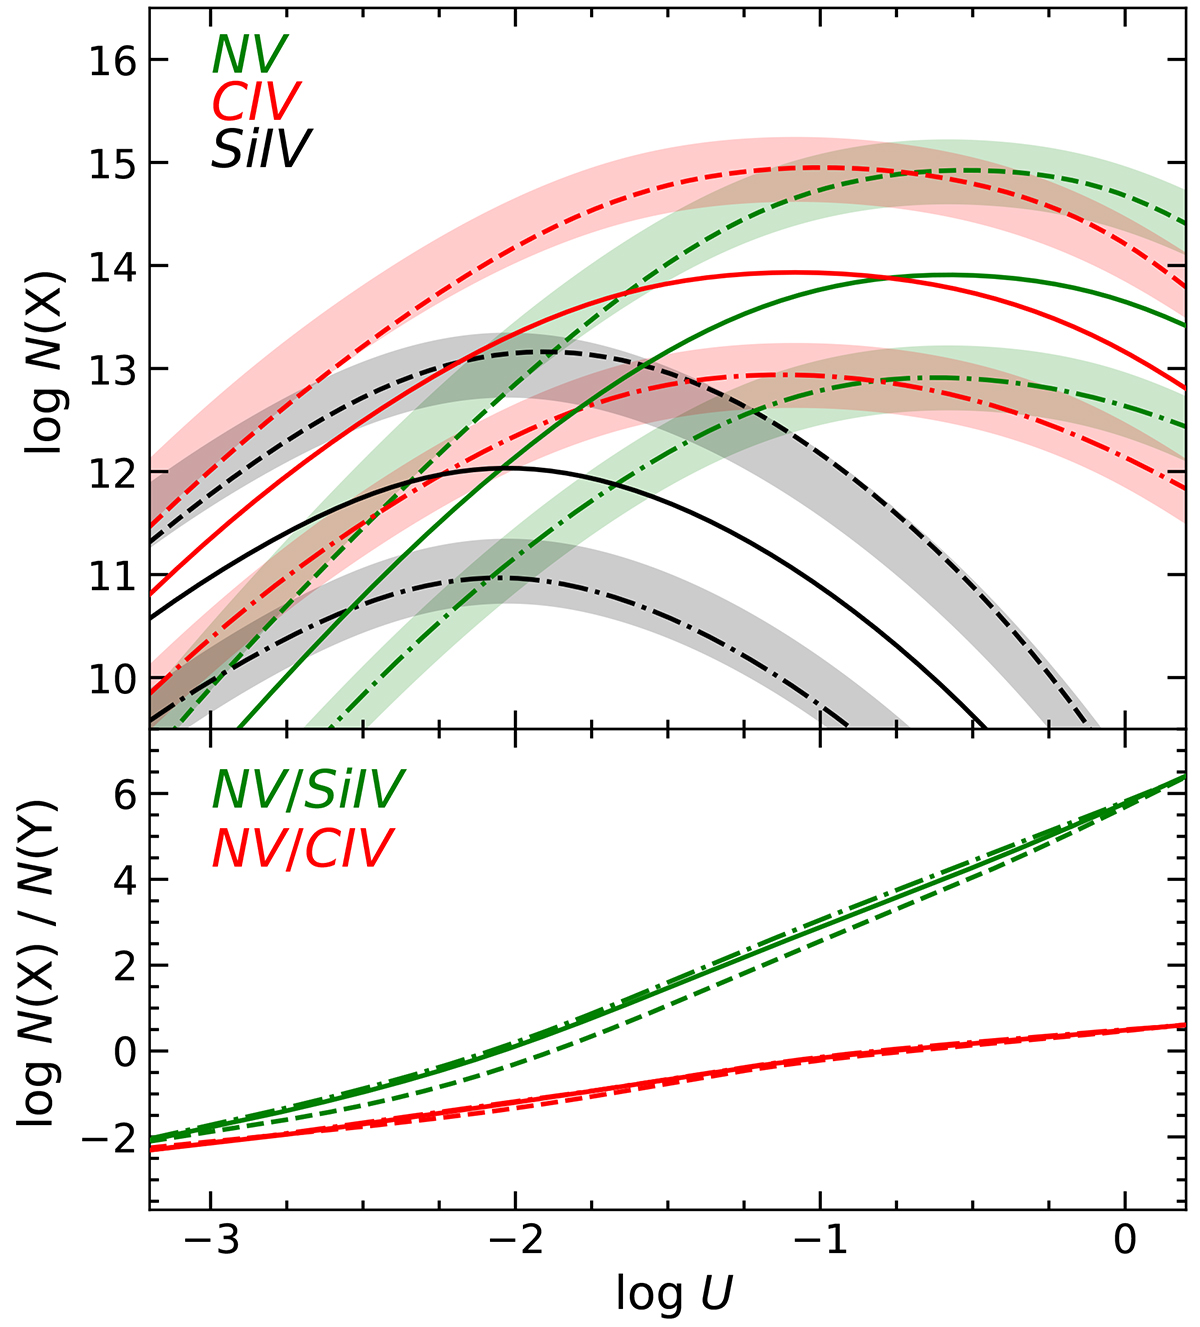
Predicted column density of N V, Si IV, and C IV (top) and the N V-to-Si IV and N V-to-C IV ratios (bottom) as a function of the ionization parameter. The solid lines correspond to the log N(H I) = 15 model in Fig. 3. The dashed (dashed-dotted) lines correspond to models that assume a ten-times-higher (lower) metallicity. The shaded areas show results from the central model (solid line), simply scaled up and down a posteriori by 1 dex. These scaled results match the predictions from the full calculations with corresponding metallicities reasonably well, typically within a factor of two (illustrated by the width of the stripes).
Current usage metrics show cumulative count of Article Views (full-text article views including HTML views, PDF and ePub downloads, according to the available data) and Abstracts Views on Vision4Press platform.
Data correspond to usage on the plateform after 2015. The current usage metrics is available 48-96 hours after online publication and is updated daily on week days.
Initial download of the metrics may take a while.