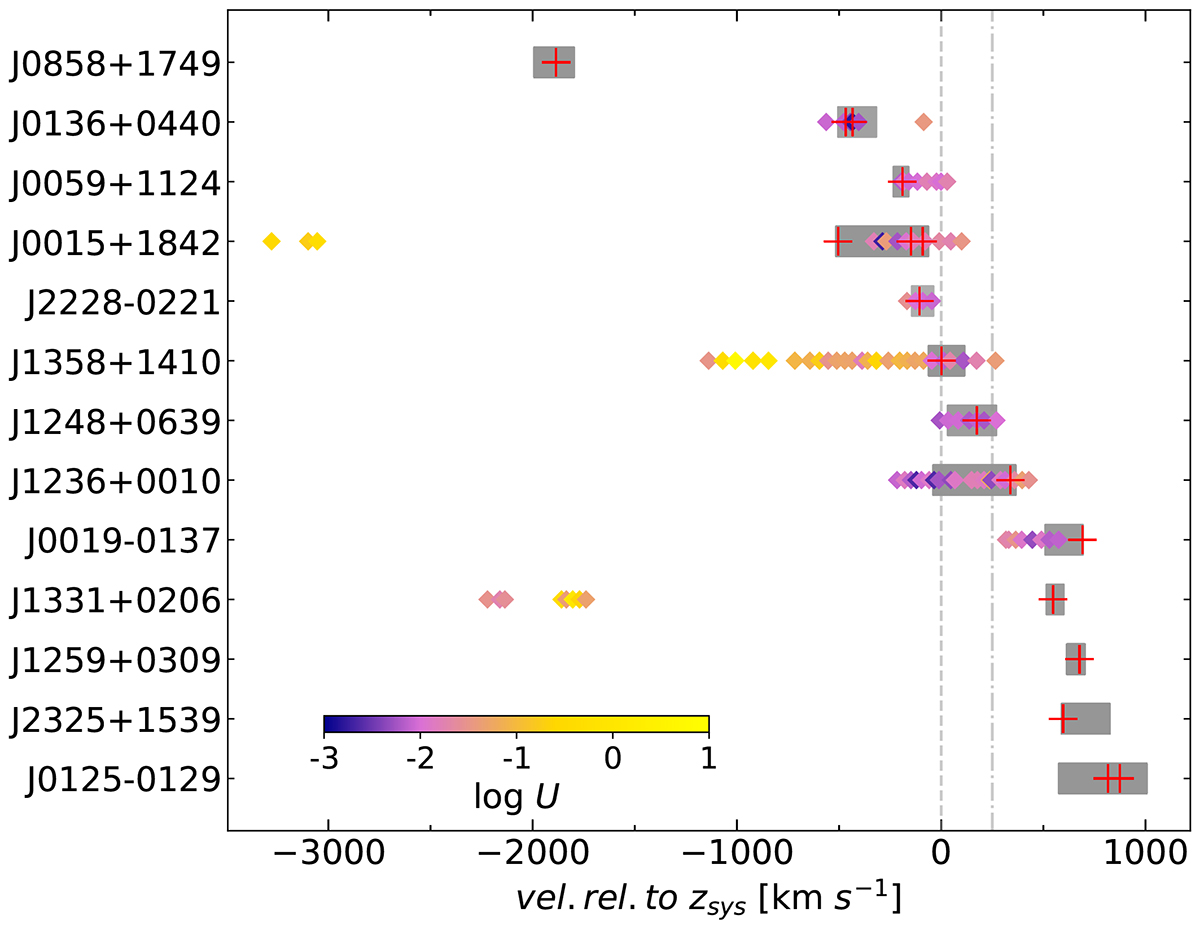
Fig. 8.
Download original image
PDLAs in our sample ordered according to the velocity difference between the centroid of the neutral gas (estimated from z50) and the systemic redshift of the quasar from optical emission lines. The dashed-dotted lines shows the typical velocity shift of the CO(3–2) emission in six systems observed with NOEMA, which may, on average, represent a better measurement of systemic redshift. The gray rectangles depict the low-ionization Δv90 range. Red crosses represent the position of H2 components. Diamonds represent N V components, colored according to the derived ionization parameter.
Current usage metrics show cumulative count of Article Views (full-text article views including HTML views, PDF and ePub downloads, according to the available data) and Abstracts Views on Vision4Press platform.
Data correspond to usage on the plateform after 2015. The current usage metrics is available 48-96 hours after online publication and is updated daily on week days.
Initial download of the metrics may take a while.