Open Access
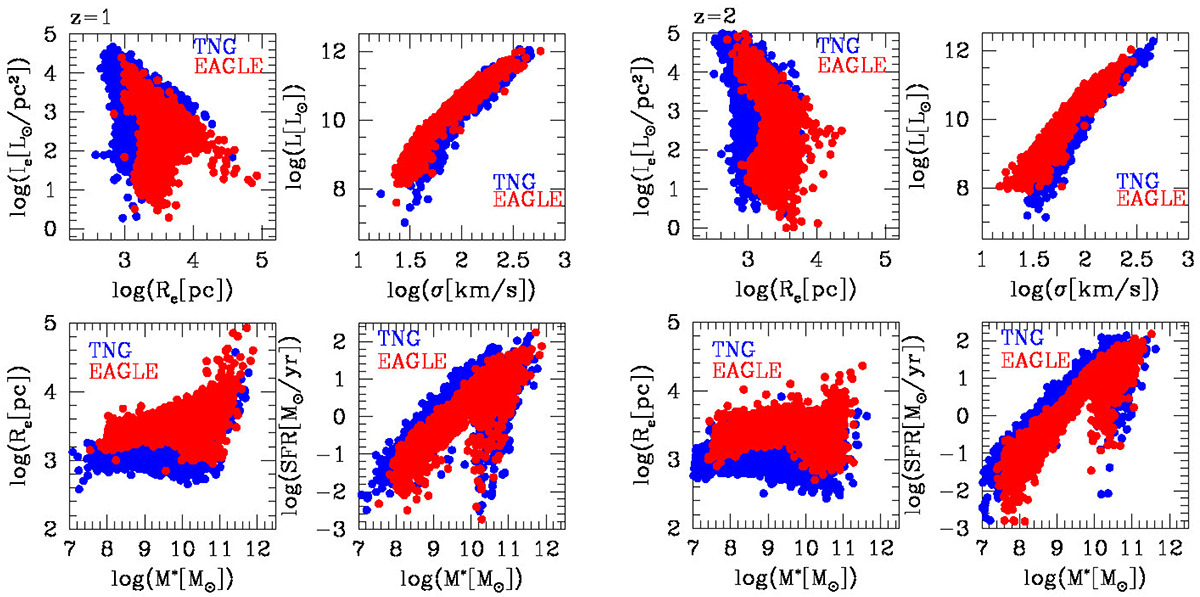
Fig. 6.
Download original image
Comparison between EAGLE (red dots) and TNG (blue dots) at z = 1 (the group of four panels at the left) and z = 2 (the group of four panels at the right) in four ScRs: the Ie − Re plane (top left), the Ie − σ plane (top right), the Re − Ms plane (bottom left), and the SFR–Ms plane (bottom right).
Current usage metrics show cumulative count of Article Views (full-text article views including HTML views, PDF and ePub downloads, according to the available data) and Abstracts Views on Vision4Press platform.
Data correspond to usage on the plateform after 2015. The current usage metrics is available 48-96 hours after online publication and is updated daily on week days.
Initial download of the metrics may take a while.