Open Access
Fig. 2.
Download original image
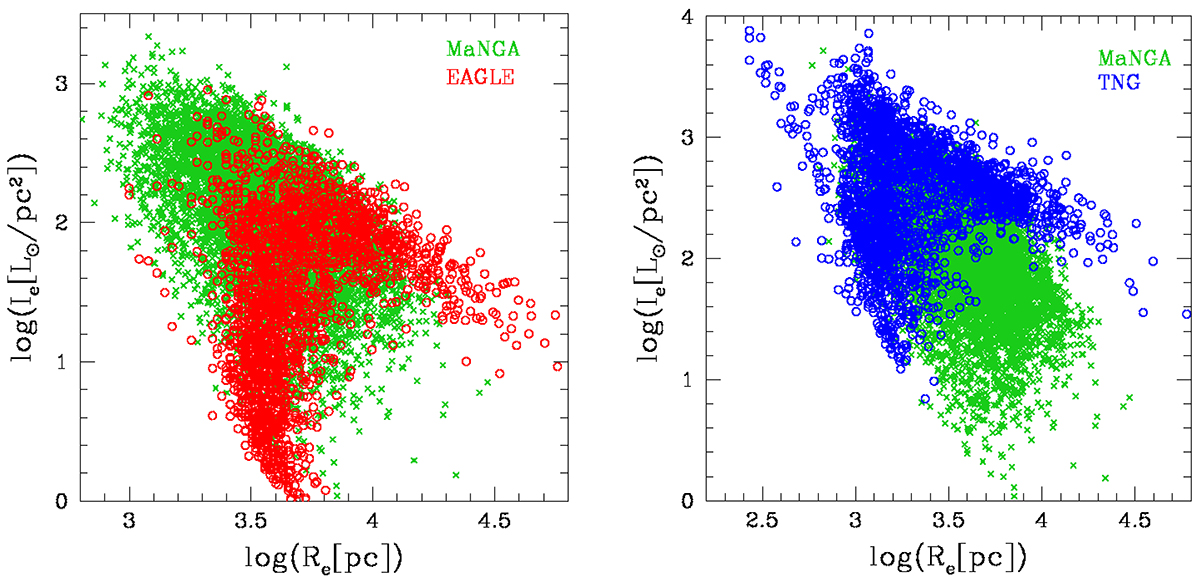
Comparison of the Ie − Re plane with the MaNGA data and simulations: EAGLE in the left panel and TNG100 in the right panel. The green crosses mark the MaNGA data for all morphological types, while the red circles are for the EAGLE data and the blue circles are for TNG100.
Current usage metrics show cumulative count of Article Views (full-text article views including HTML views, PDF and ePub downloads, according to the available data) and Abstracts Views on Vision4Press platform.
Data correspond to usage on the plateform after 2015. The current usage metrics is available 48-96 hours after online publication and is updated daily on week days.
Initial download of the metrics may take a while.