Fig. 15.
Download original image
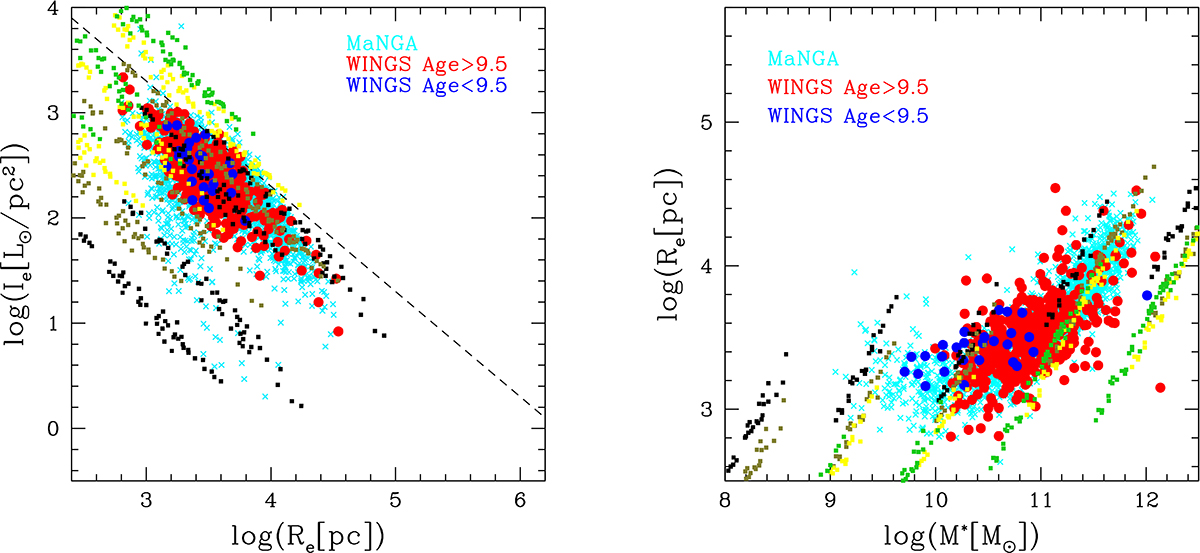
Comparison of simulated galaxies of Mod-B described by Eqs. (31)–(36) with the observational data of MaNGA (see Blanton et al. 2017, and references therein) and WINGS (see text for descriptions). Only E and S0 galaxies are considered here. Left panel: Ie − Re plane where the sky-blue dots are the MaNGA data, while the red and blue filled circles are the WINGS galaxies of different ages, as indicated. The black squares are our simulated mergers starting at z = 0. Similarly, the coloured dots mark mergers at increasing redshift: coral (z = 1), yellow (z = 2), and green (z = 3). The dashed line is the ZoE. Right panel: Re − Ms plane of the same data. In the two panels, the parameters η, ϵ, and λ are randomly varied in the intervals 0.1 ≤ η ≤ 0.3, 0.1 ≤ ϵ ≤ 0.3, and 0 ≤ λ ≤ 0.3. In addition, the expression for the luminosity contains the parameter θ, which is randomly varied at each step in the interval 1 ≤ θ ≤ 3. The value of N changes for the massive and less massive galaxies. The meaning of the symbols and colour-coding are as in Fig. 11.
Current usage metrics show cumulative count of Article Views (full-text article views including HTML views, PDF and ePub downloads, according to the available data) and Abstracts Views on Vision4Press platform.
Data correspond to usage on the plateform after 2015. The current usage metrics is available 48-96 hours after online publication and is updated daily on week days.
Initial download of the metrics may take a while.