Fig. 10.
Download original image
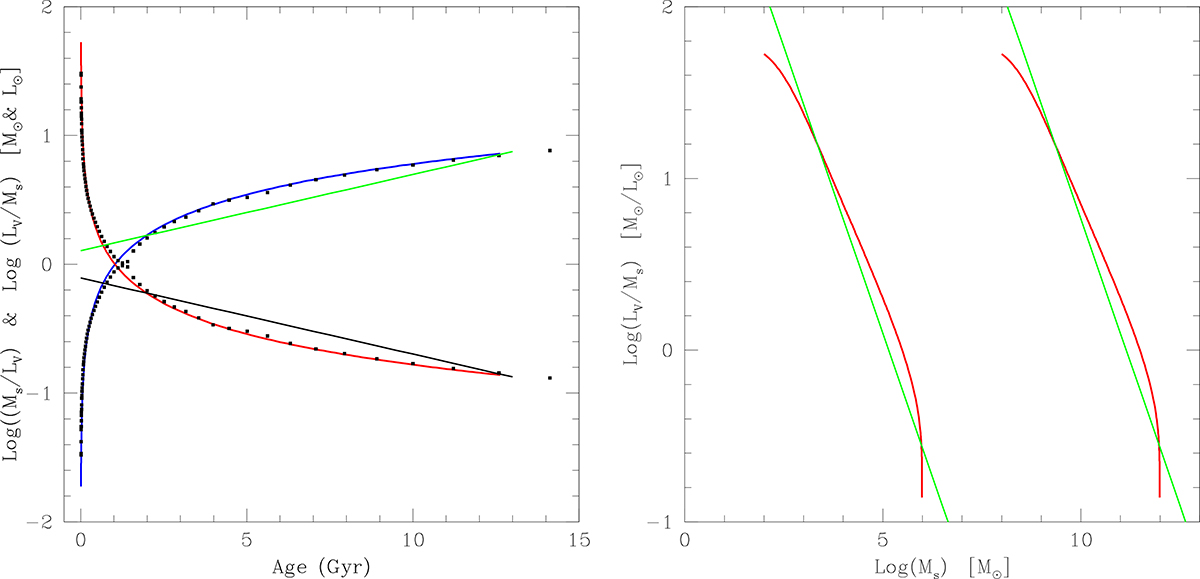
Mass-to-luminosity and luminosity-to-mass ratios as functions of the age (left panel) and the luminosity-to-mass ratio as a function of the stellar mass Ms (right panel). The masses and luminosities are in solar units, the age is in Gyr. Left panel: In the panel the solid red and blue lines are the Ms/LV and Lv/Ms ratios, respectively, for an infall model of asymptotic mass of 1010 M⊙ calculated by the authors (see Chiosi et al. 2023, and references), while the black dots along each line are the same, but for a SSP with solar chemical composition taken from the Padova library (Tantalo 2005). The straight lines are the best fit of the relations. Right panel: Ms/LV ratio for two infall models with different masses. For each case the stellar mass increases along each curve from left to right. The two straight lines are the best fit of the data (see text for more details).
Current usage metrics show cumulative count of Article Views (full-text article views including HTML views, PDF and ePub downloads, according to the available data) and Abstracts Views on Vision4Press platform.
Data correspond to usage on the plateform after 2015. The current usage metrics is available 48-96 hours after online publication and is updated daily on week days.
Initial download of the metrics may take a while.