Fig. 5
Download original image
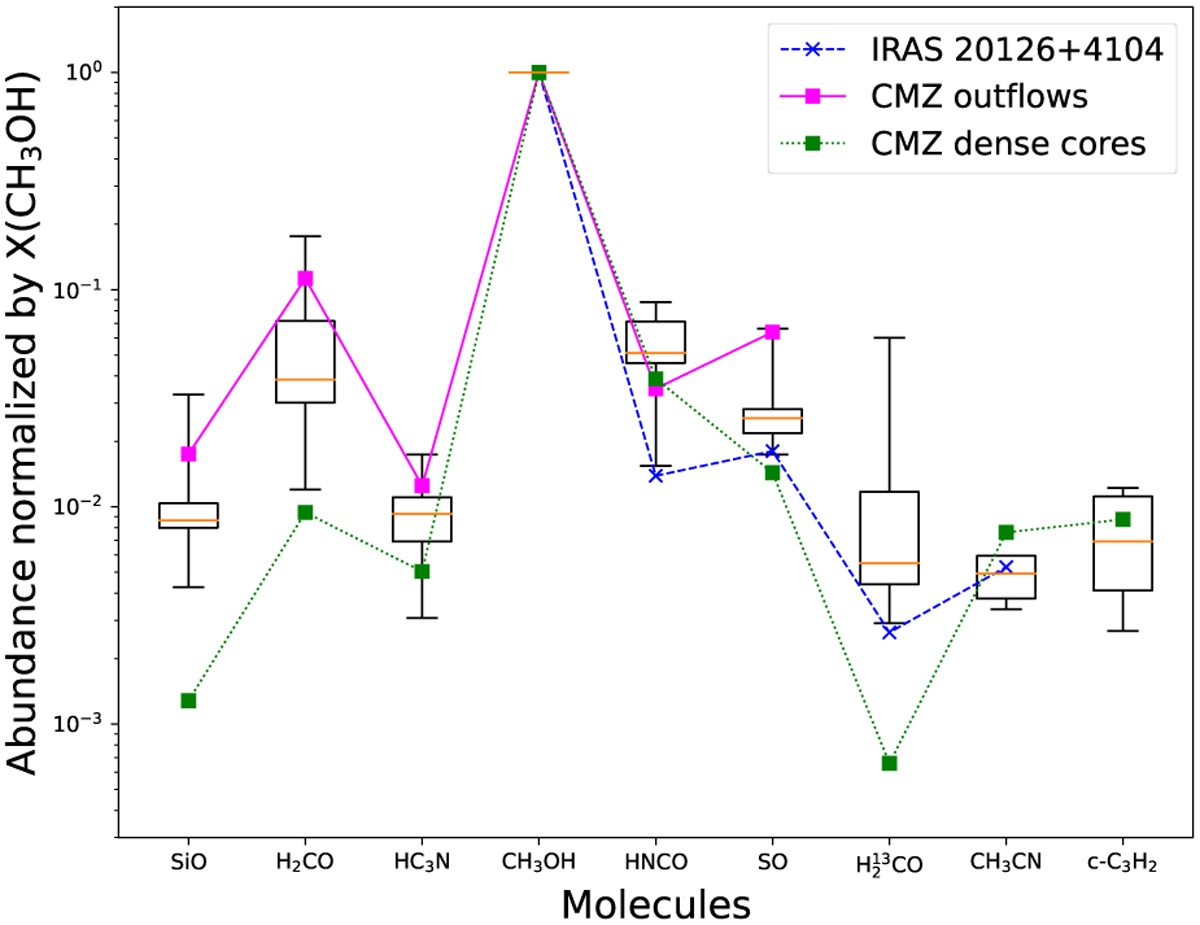
Molecular abundances normalized with respected to the abundance of CH3OH. The boxes denote the first to third quartiles while the caps mark the full range of abundances in our slim filaments. The median of abundances of each molecule is marked by a horizontal orange line. The abundances of the outflow from a high-mass protostar IRAS 20126+4104 (Palau et al. 2017), and of the dense cores (Paper I) and outflows (Paper II) in the CMZ are also plotted. The systematic uncertainties in the abundances are not plotted here.
Current usage metrics show cumulative count of Article Views (full-text article views including HTML views, PDF and ePub downloads, according to the available data) and Abstracts Views on Vision4Press platform.
Data correspond to usage on the plateform after 2015. The current usage metrics is available 48-96 hours after online publication and is updated daily on week days.
Initial download of the metrics may take a while.