Fig. 4.
Download original image
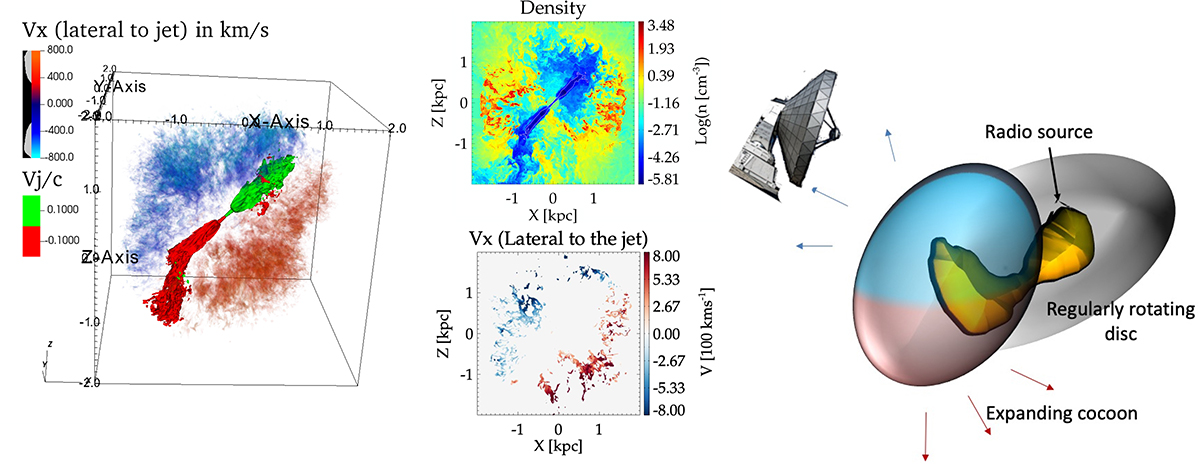
Left: panel (a) depicts the 3D volume rendering of the velocity component lateral to the jet axis (see Sec. 4 for details) for dense gas (n ≥ 10 cm−3), from the simulations of jet–ISM interaction in Fabbiano et al. (2022). A 2D cross-section of this image in the X − Z plane is shown in panel (c). The red and blue colours show oppositely directed flows with respect to the jet-axis, expanding as a bubble. The pair of relativistic jets are presented using the contours of |v| = 0.1 c in green and magenta. Panel (b) shows the cross-section of the gas density in X − Z plane. Right: cartoon image representing the proposed model of the evolution of a jet-driven bubble in the southern jet, where the line of sight traces both sides of the expanding bubble.
Current usage metrics show cumulative count of Article Views (full-text article views including HTML views, PDF and ePub downloads, according to the available data) and Abstracts Views on Vision4Press platform.
Data correspond to usage on the plateform after 2015. The current usage metrics is available 48-96 hours after online publication and is updated daily on week days.
Initial download of the metrics may take a while.