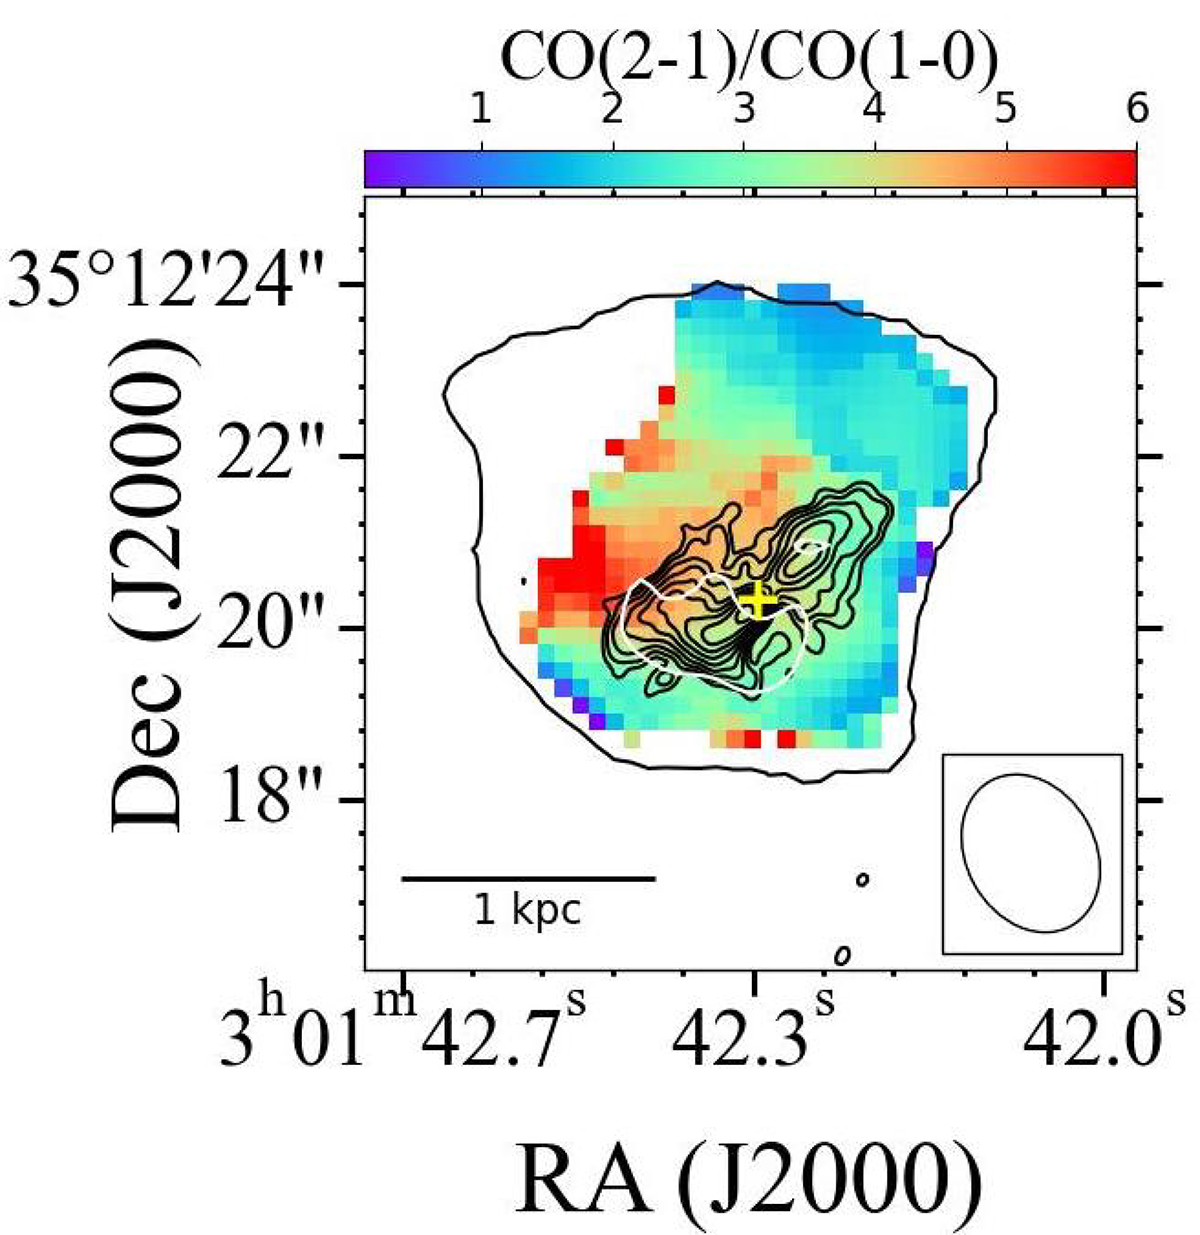
Fig. 3.
Download original image
The CO(2–1)/CO(1–0), line ratio (R21) map for the regions where the emission is detected in both transitions. The black contour marks the entire region from which we detect CO(2–1) emission. The black contours in the centre show the 8.4 GHz radio continuum from Giroletti et al. (2005). The yellow cross shows the radio core. The white contour shows the region of soft X-ray emission detected in Chandra observations reported in (see Fig. 6, right, in Fabbiano et al. 2022).
Current usage metrics show cumulative count of Article Views (full-text article views including HTML views, PDF and ePub downloads, according to the available data) and Abstracts Views on Vision4Press platform.
Data correspond to usage on the plateform after 2015. The current usage metrics is available 48-96 hours after online publication and is updated daily on week days.
Initial download of the metrics may take a while.