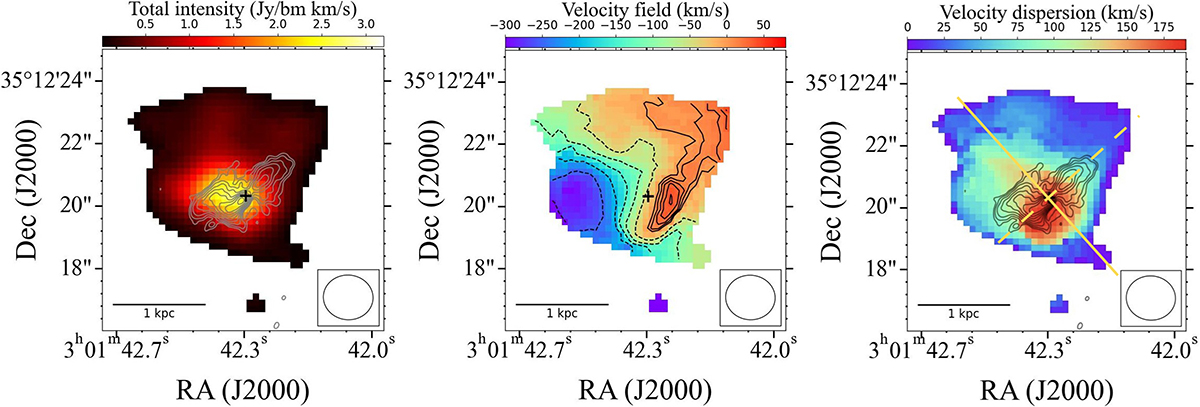
Fig. 1.
Download original image
Moment maps of the CO(2–1) emission. Left: total intensity (moment-0) map, Centre: velocity field (moment-1 map). The dashed contours represent the blue-shifted velocities and the solid contours represent the redshifted velocities, and Right: velocity dispersion (moment-2) map. The yellow solid line indicates the radio axis and the yellow dashed line indicates the axis is perpendicular to the radio axis. These two correspond to the axes of the position-velocity slices shown in Figs. 2a,c and 2b, respectively. The 8.4 GHz radio continuum from Giroletti et al. (2005) is shown in grey and black contours in moment-0 and moment-2 maps, respectively. The radio core is marked with a black cross in all three images.
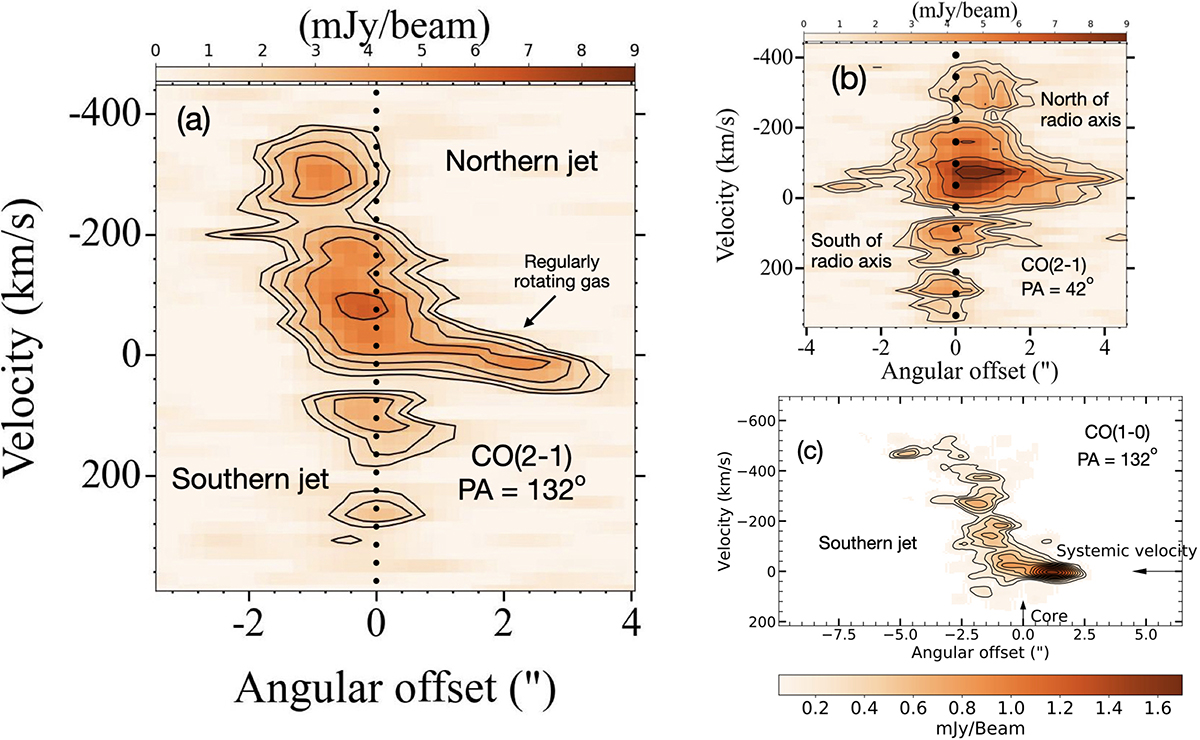
Fig. 2.
Position–velocity slices of the molecular gas disc. (a) PV slice along the radio axis. The dashed line shows the location of the core and divides the gas into two regions along the two jets. We find that the gas with anomalous velocities is offset from the core by ∼500 pc along the southern radio jet. (b) PV slice along the axis perpendicular to the radio jets (PA = 42°). The dotted line corresponds to the radio axis and divides the gas into regions to the north and south of the radio axis. The blue-shifted gas is concentrated to the north of the radio axis, while the redshifted gas corresponds to the south of the radio axis. (c) PV slice of the gas seen in CO(1–0) emission along the radio axis, where only the blue-shifted gas was detected (Murthy et al. 2022).
Current usage metrics show cumulative count of Article Views (full-text article views including HTML views, PDF and ePub downloads, according to the available data) and Abstracts Views on Vision4Press platform.
Data correspond to usage on the plateform after 2015. The current usage metrics is available 48-96 hours after online publication and is updated daily on week days.
Initial download of the metrics may take a while.