Fig. 9.
Download original image
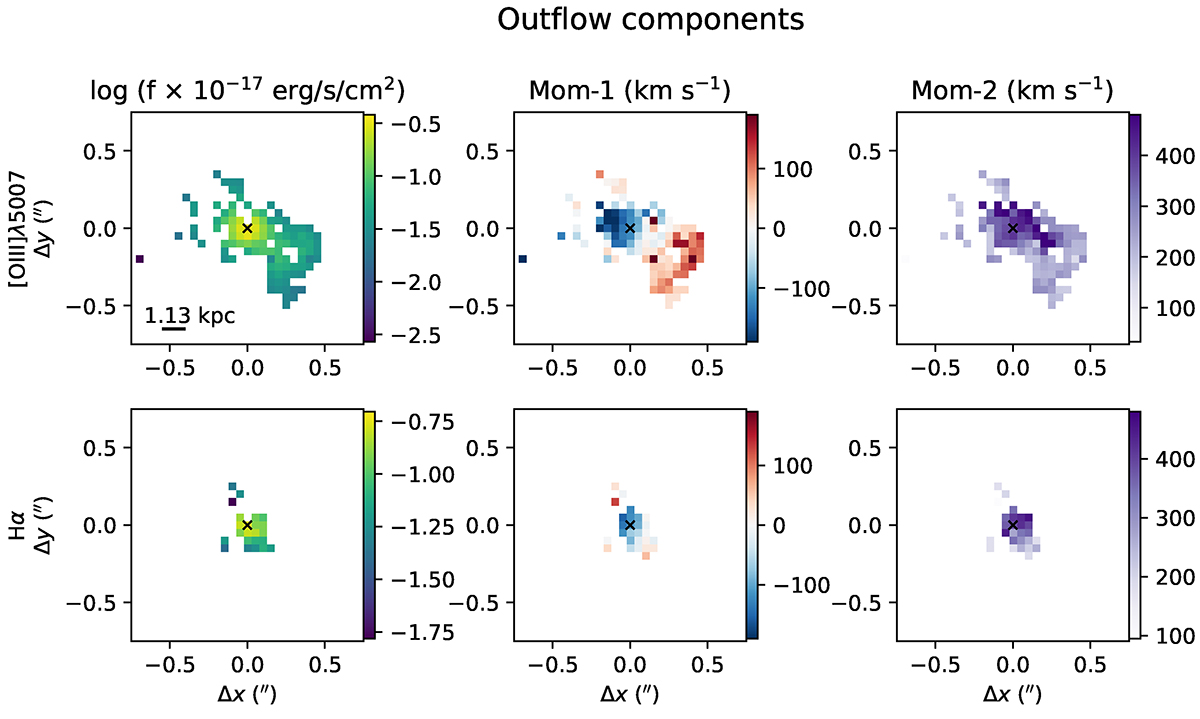
[O III] (top) and Hα (bottom) flux, moment-1 and moment-2 maps for the outflow kinematic component. A S/N cut of 4 has been applied to generate the maps. The [O III] maps show a typical biconical outflow structure, oriented along the NE-SW direction, consistent with our spectro-astrometry analysis (Sect. 4.1). The Hα flux distribution is less extended, as this Balmer line is fainter than [O III].
Current usage metrics show cumulative count of Article Views (full-text article views including HTML views, PDF and ePub downloads, according to the available data) and Abstracts Views on Vision4Press platform.
Data correspond to usage on the plateform after 2015. The current usage metrics is available 48-96 hours after online publication and is updated daily on week days.
Initial download of the metrics may take a while.