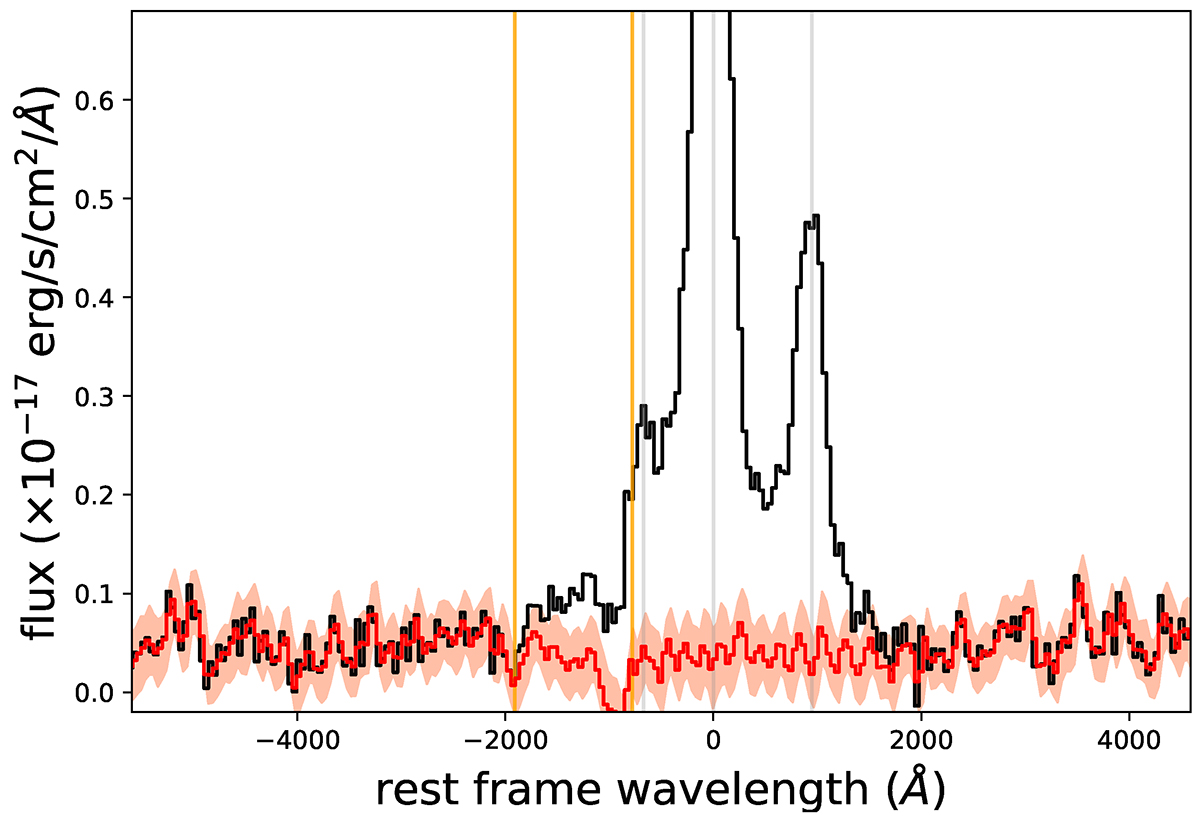
Fig. 5.
Download original image
GS133 spectrum showing tentative Balmer absorption detection in the vicinity of Hα and [N II] emission lines. The black curve shows the integrated spectrum in velocity space, with v = 0 km s−1 at the position of the Hα line. The red curve (with 1σ uncertainties in light-red) displays the residuals obtained by subtracting the best-fit Gaussian emission lines presented in Fig. 2. Two low S/N absorption features are detected close to the orange vertical lines, which mark the velocities of the mini-BAL features observed in the UV (see Table 2).
Current usage metrics show cumulative count of Article Views (full-text article views including HTML views, PDF and ePub downloads, according to the available data) and Abstracts Views on Vision4Press platform.
Data correspond to usage on the plateform after 2015. The current usage metrics is available 48-96 hours after online publication and is updated daily on week days.
Initial download of the metrics may take a while.