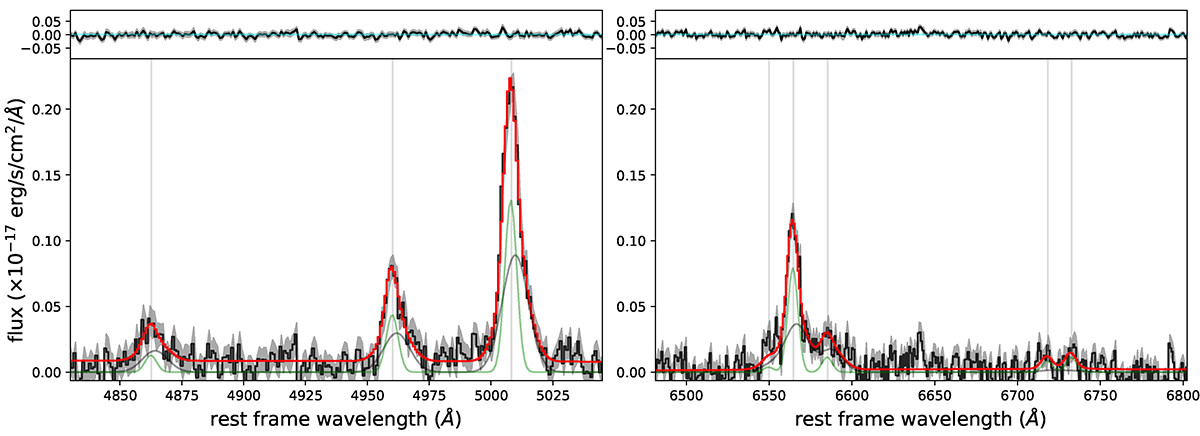
Fig. B.2.
Download original image
NIRSpec integrated spectrum of SW cone, showing the redshifted outflow. The black curve identifies the integrated spectrum, integrated over a circular region identified by the light-red crescent moon in the inset in Fig. 10; the total, multi-component best fit curve is in red, while the green and and grey Gaussian components show the systemic and outflow, respectively. The fit residuals are reported in the top panels. The most prominent emission lines are marked with grey vertical lines.
Current usage metrics show cumulative count of Article Views (full-text article views including HTML views, PDF and ePub downloads, according to the available data) and Abstracts Views on Vision4Press platform.
Data correspond to usage on the plateform after 2015. The current usage metrics is available 48-96 hours after online publication and is updated daily on week days.
Initial download of the metrics may take a while.