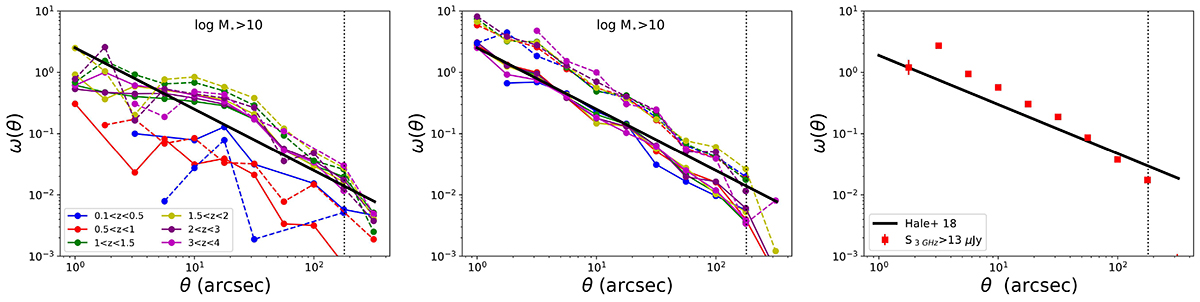
Fig. 5.
Download original image
Angular TPCF of mock galaxies and radio sources. Left: Angular TPCF of mock EGG galaxies with stellar mass > 1010 M⊙ at different redshift bins. A straight line with power law slope of −1 is also plotted. Middle: Angular TPCF of redistributed mock EGG galaxies with stellar mass > 1010 M⊙ at different redshift bins. A straight line with power law slope of −1 is also plotted. Solid and dashed lines represent active and passive galaxies respectively. Right: Angular TPCF of our mock radio AGNs with 3 GHz flux density above 13 μJy. We also plot the best-fit model from Hale et al. (2018) with a slope of −0.8. The vertical dotted line denotes the clump radius of 3′ (see Sect. 2.4).
Current usage metrics show cumulative count of Article Views (full-text article views including HTML views, PDF and ePub downloads, according to the available data) and Abstracts Views on Vision4Press platform.
Data correspond to usage on the plateform after 2015. The current usage metrics is available 48-96 hours after online publication and is updated daily on week days.
Initial download of the metrics may take a while.