Fig. 4.
Download original image
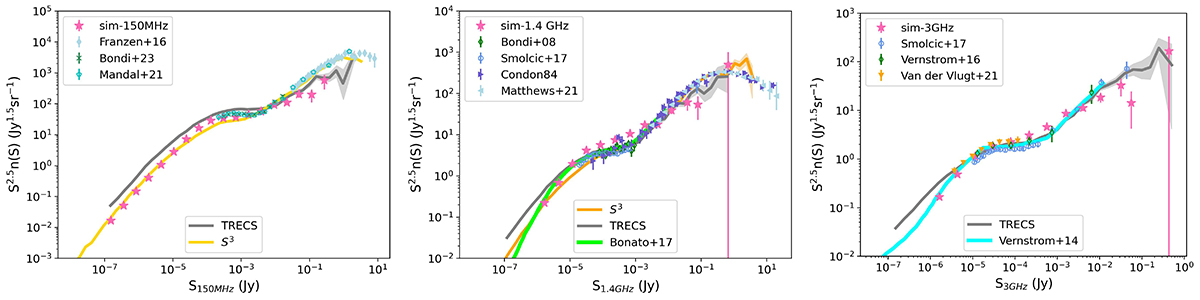
Differential source counts of our catalog at various bands and comparisons to literature work. Left: Comparisons of differential source counts at 150 MHz to observations in Franzen et al. (2016), Mandal et al. (2021), Bondi et al. (2024) along with S3 and TRECS simulations (Wilman et al. 2008, Bonaldi et al. 2019). Middle: Comparisons of differential source counts at 1.4 GHz to observations in Condon (1984), Bondi et al. (2008), Smolčić et al. (2017b), Matthews et al. (2021), theoretical work in Bonato et al. (2017), along with S3 and TRECS simulations (Wilman et al. 2008; Bonaldi et al. 2019). Right: Comparisons of differential source counts at 3 GHz to observations in Vernstrom et al. (2016), Smolčić et al. (2017b), van der Vlugt et al. (2021), P(D) analysis in Vernstrom et al. (2014) and the TRECS simulation (Bonaldi et al. 2019).
Current usage metrics show cumulative count of Article Views (full-text article views including HTML views, PDF and ePub downloads, according to the available data) and Abstracts Views on Vision4Press platform.
Data correspond to usage on the plateform after 2015. The current usage metrics is available 48-96 hours after online publication and is updated daily on week days.
Initial download of the metrics may take a while.