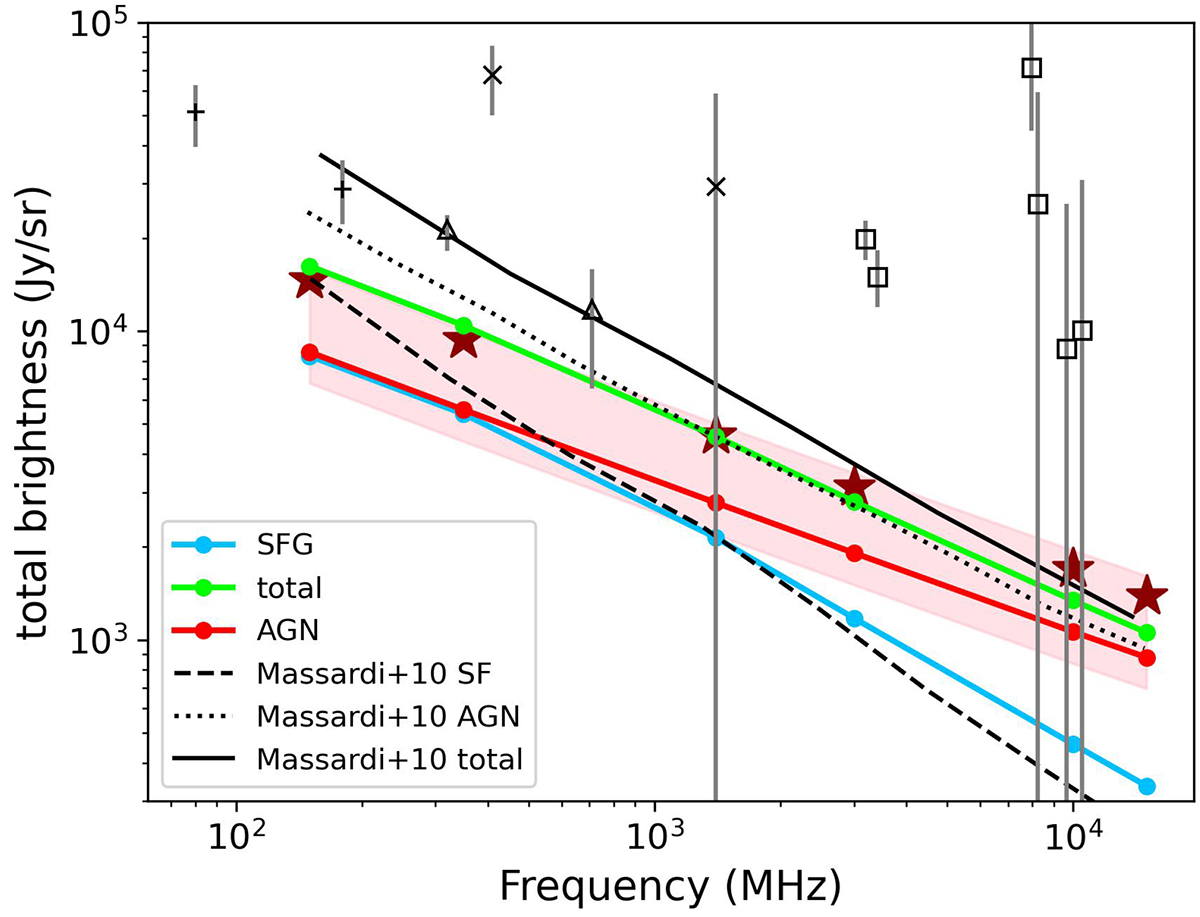
Fig. 10.
Download original image
Contribution from radio AGNs (red) and SFGs (blue) along with their sum (green) to the ERB at various frequencies. We also compare our results with the model from Massardi et al. (2010). Data points are from Bridle (1967), Wall et al. (1970), Fixsen (2009) (see Figure 9 in Massardi et al. 2010). The red stars denote the contribution from radio AGN plus a single source with ![]() at z = 0.4. The shaded region represent the 5/95 boundary of radio AGN contribution when running the assignment 200 times.
at z = 0.4. The shaded region represent the 5/95 boundary of radio AGN contribution when running the assignment 200 times.
Current usage metrics show cumulative count of Article Views (full-text article views including HTML views, PDF and ePub downloads, according to the available data) and Abstracts Views on Vision4Press platform.
Data correspond to usage on the plateform after 2015. The current usage metrics is available 48-96 hours after online publication and is updated daily on week days.
Initial download of the metrics may take a while.