Fig. 6
Download original image
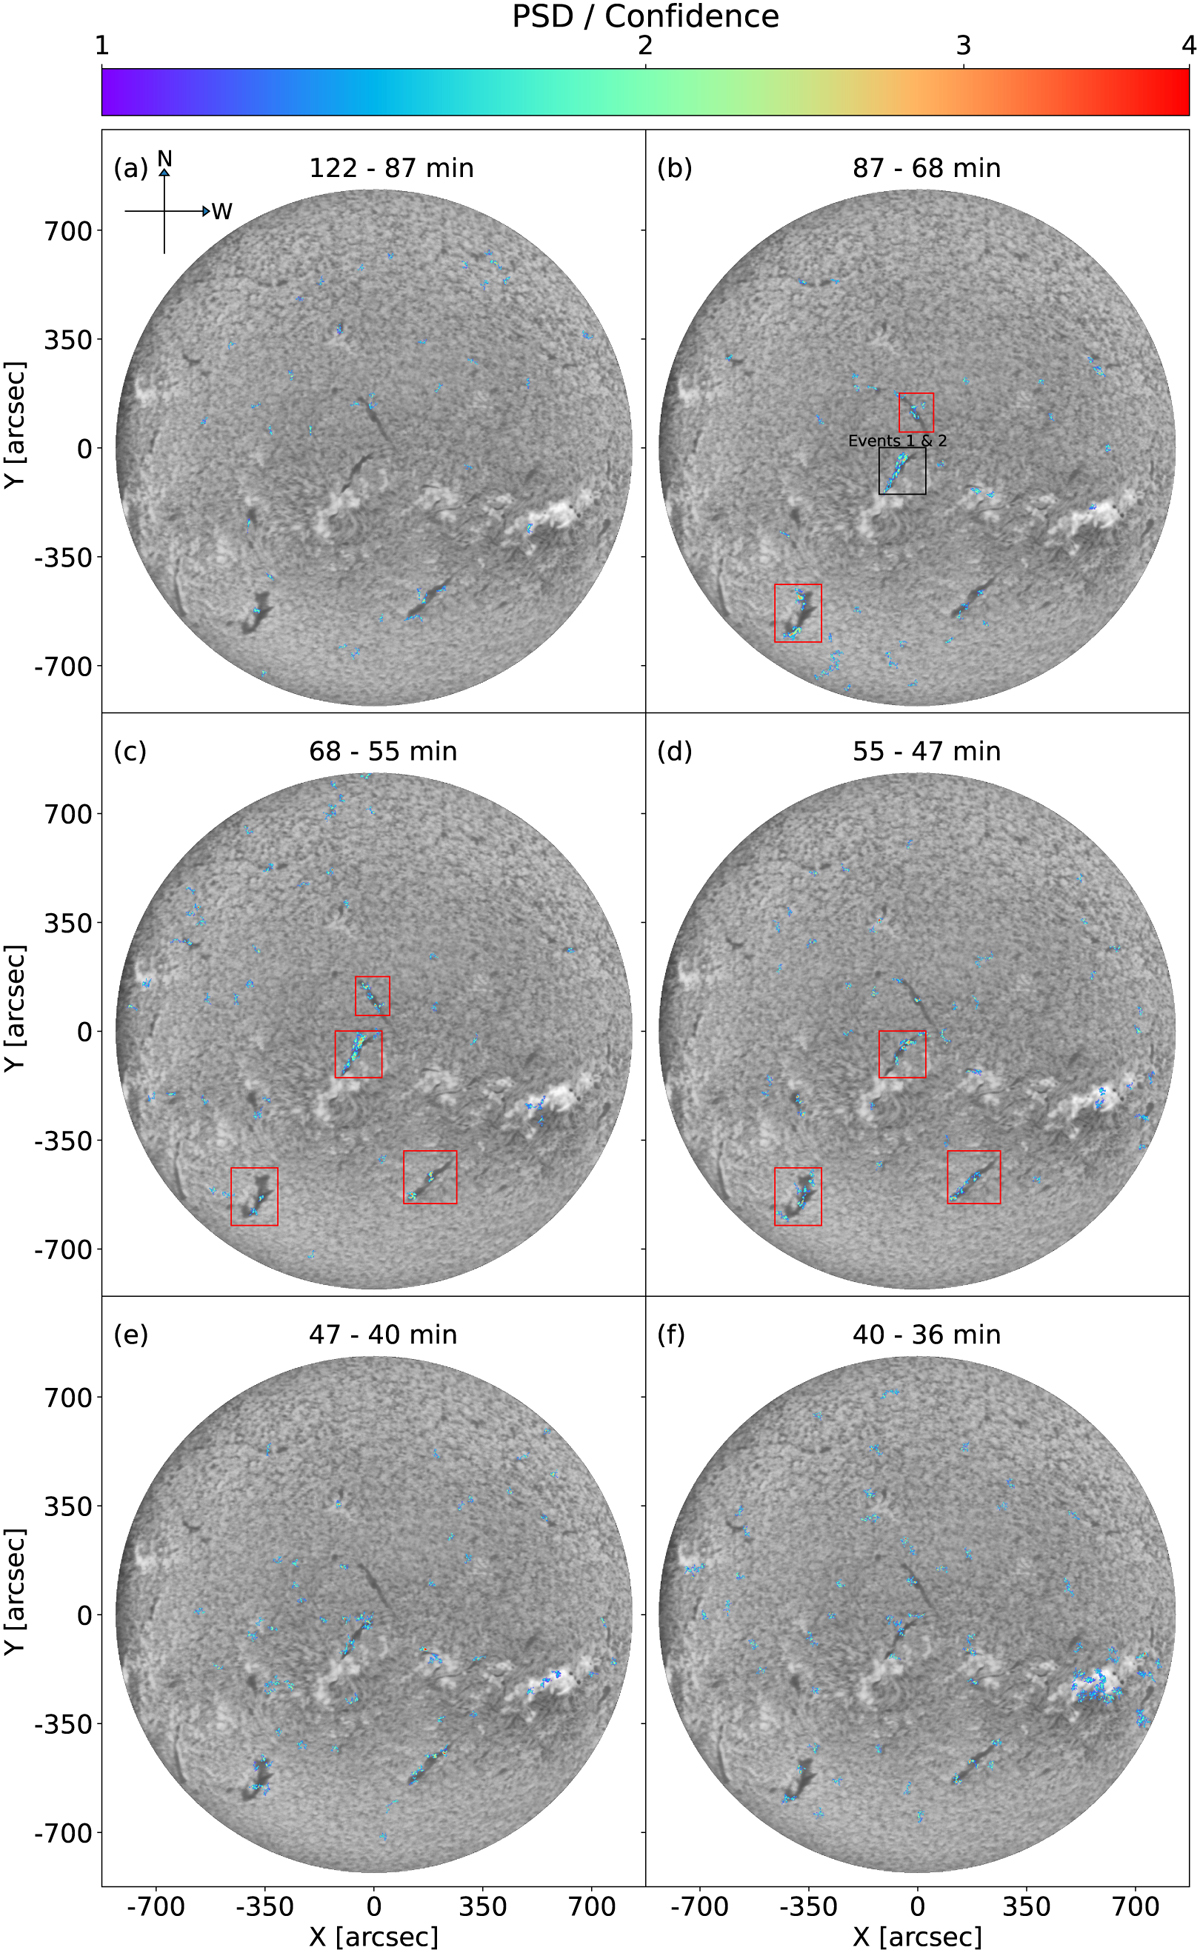
Ratio of the PSD over the predicted confidence line from the CNN model for 1 January 2014 over the background Hα intensity map (the Hα maps have an artificially increased contrast for clearer visualization of the dark structures). The predictions were binned in frequency with an increment of 0.055 mHz. We show the approximate period ranges associated with each frequency bin. The black boxes represent events reported in Luna et al. (2018) within the respective period range. The red boxes represent newly detected events that are thought to be related to filament oscillations that are further discussed in the text.
Current usage metrics show cumulative count of Article Views (full-text article views including HTML views, PDF and ePub downloads, according to the available data) and Abstracts Views on Vision4Press platform.
Data correspond to usage on the plateform after 2015. The current usage metrics is available 48-96 hours after online publication and is updated daily on week days.
Initial download of the metrics may take a while.