Fig. A.2.
Download original image
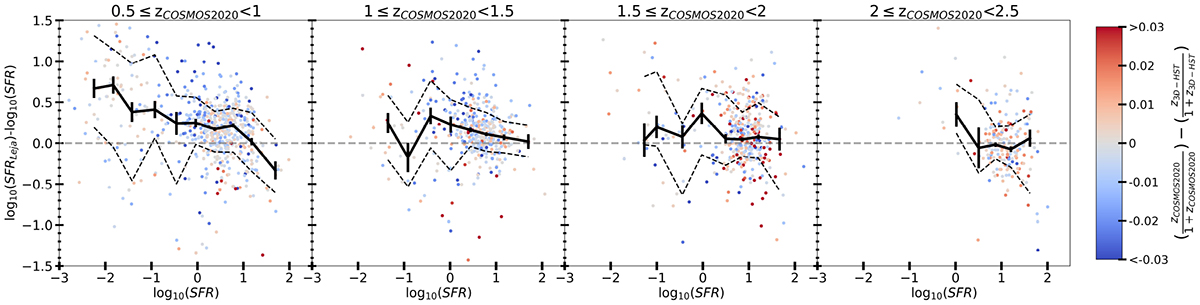
Difference in SFR measured in this work and in Leja et al. (2020) as a function of the SFR retrieved in this work in 4 redshift bins. Color coding conveys the difference of the relative redshift estimates from the COSMOS2020 catalog (used in this work) and in the 3D-HST catalog (used in Leja et al. 2020). The solid black line shows the median difference with error bars representing the statistical uncertainty ![]() while dashed lines show the 16-84 percentile range. Systematic differences are on the order of 0.1-0.2 dex for high-SFR galaxies and up to 0.6 dex for low-SFR ones. These differences do not play a major role in this work.
while dashed lines show the 16-84 percentile range. Systematic differences are on the order of 0.1-0.2 dex for high-SFR galaxies and up to 0.6 dex for low-SFR ones. These differences do not play a major role in this work.
Current usage metrics show cumulative count of Article Views (full-text article views including HTML views, PDF and ePub downloads, according to the available data) and Abstracts Views on Vision4Press platform.
Data correspond to usage on the plateform after 2015. The current usage metrics is available 48-96 hours after online publication and is updated daily on week days.
Initial download of the metrics may take a while.