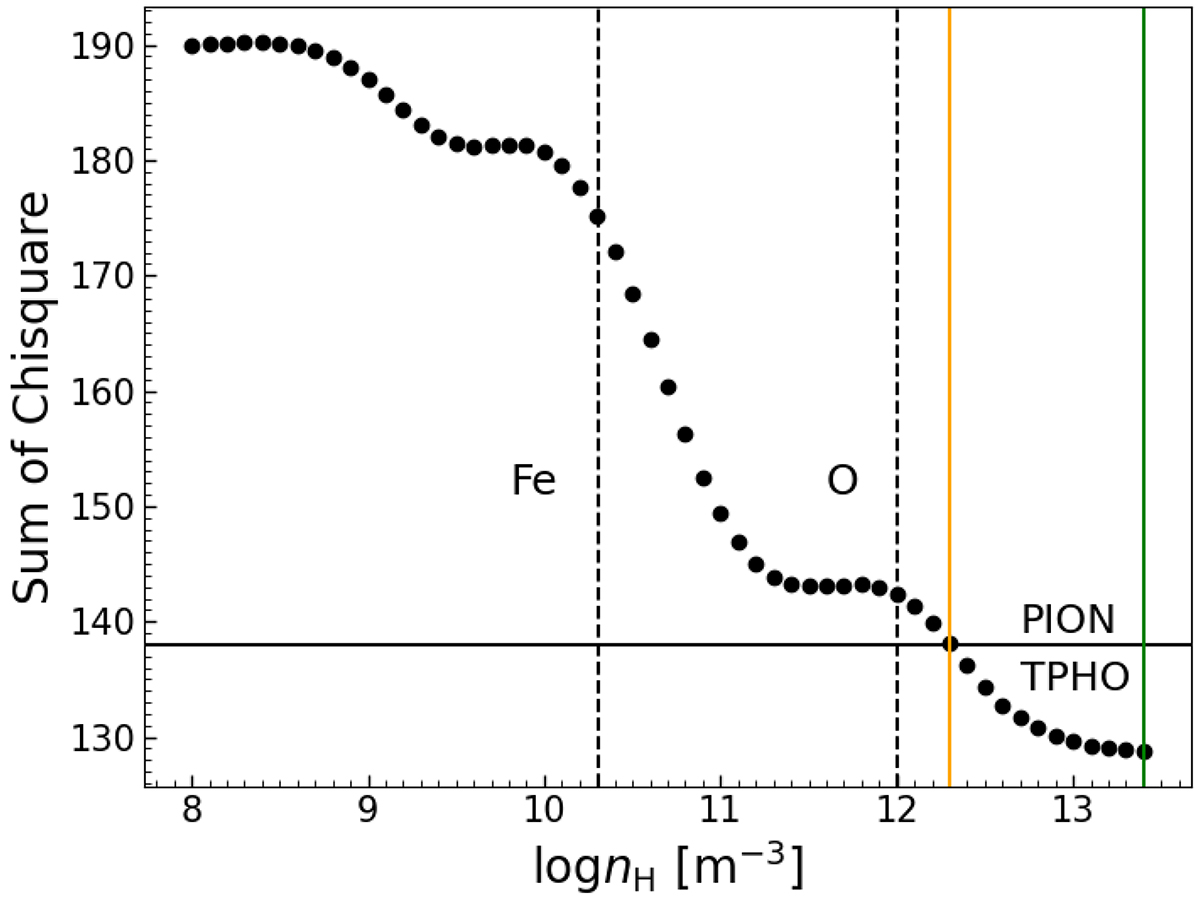
Fig. 9.
Download original image
Sum of chi-square values from Fig. 8 vs. density (black dots). The minimum chi-square value of 128.76 is obtained for a density of 1013.4 m−3 (green line). The chi-square value for fits with the pion model is shown as a solid horizontal line, which is higher than the tpho value at the 3σ confidence level (orange line). The vertical dashed lines indicate the densities of the outflow corresponding to a recombination time scale of 105 s for oxygen and iron.
Current usage metrics show cumulative count of Article Views (full-text article views including HTML views, PDF and ePub downloads, according to the available data) and Abstracts Views on Vision4Press platform.
Data correspond to usage on the plateform after 2015. The current usage metrics is available 48-96 hours after online publication and is updated daily on week days.
Initial download of the metrics may take a while.