Fig. 6.
Download original image
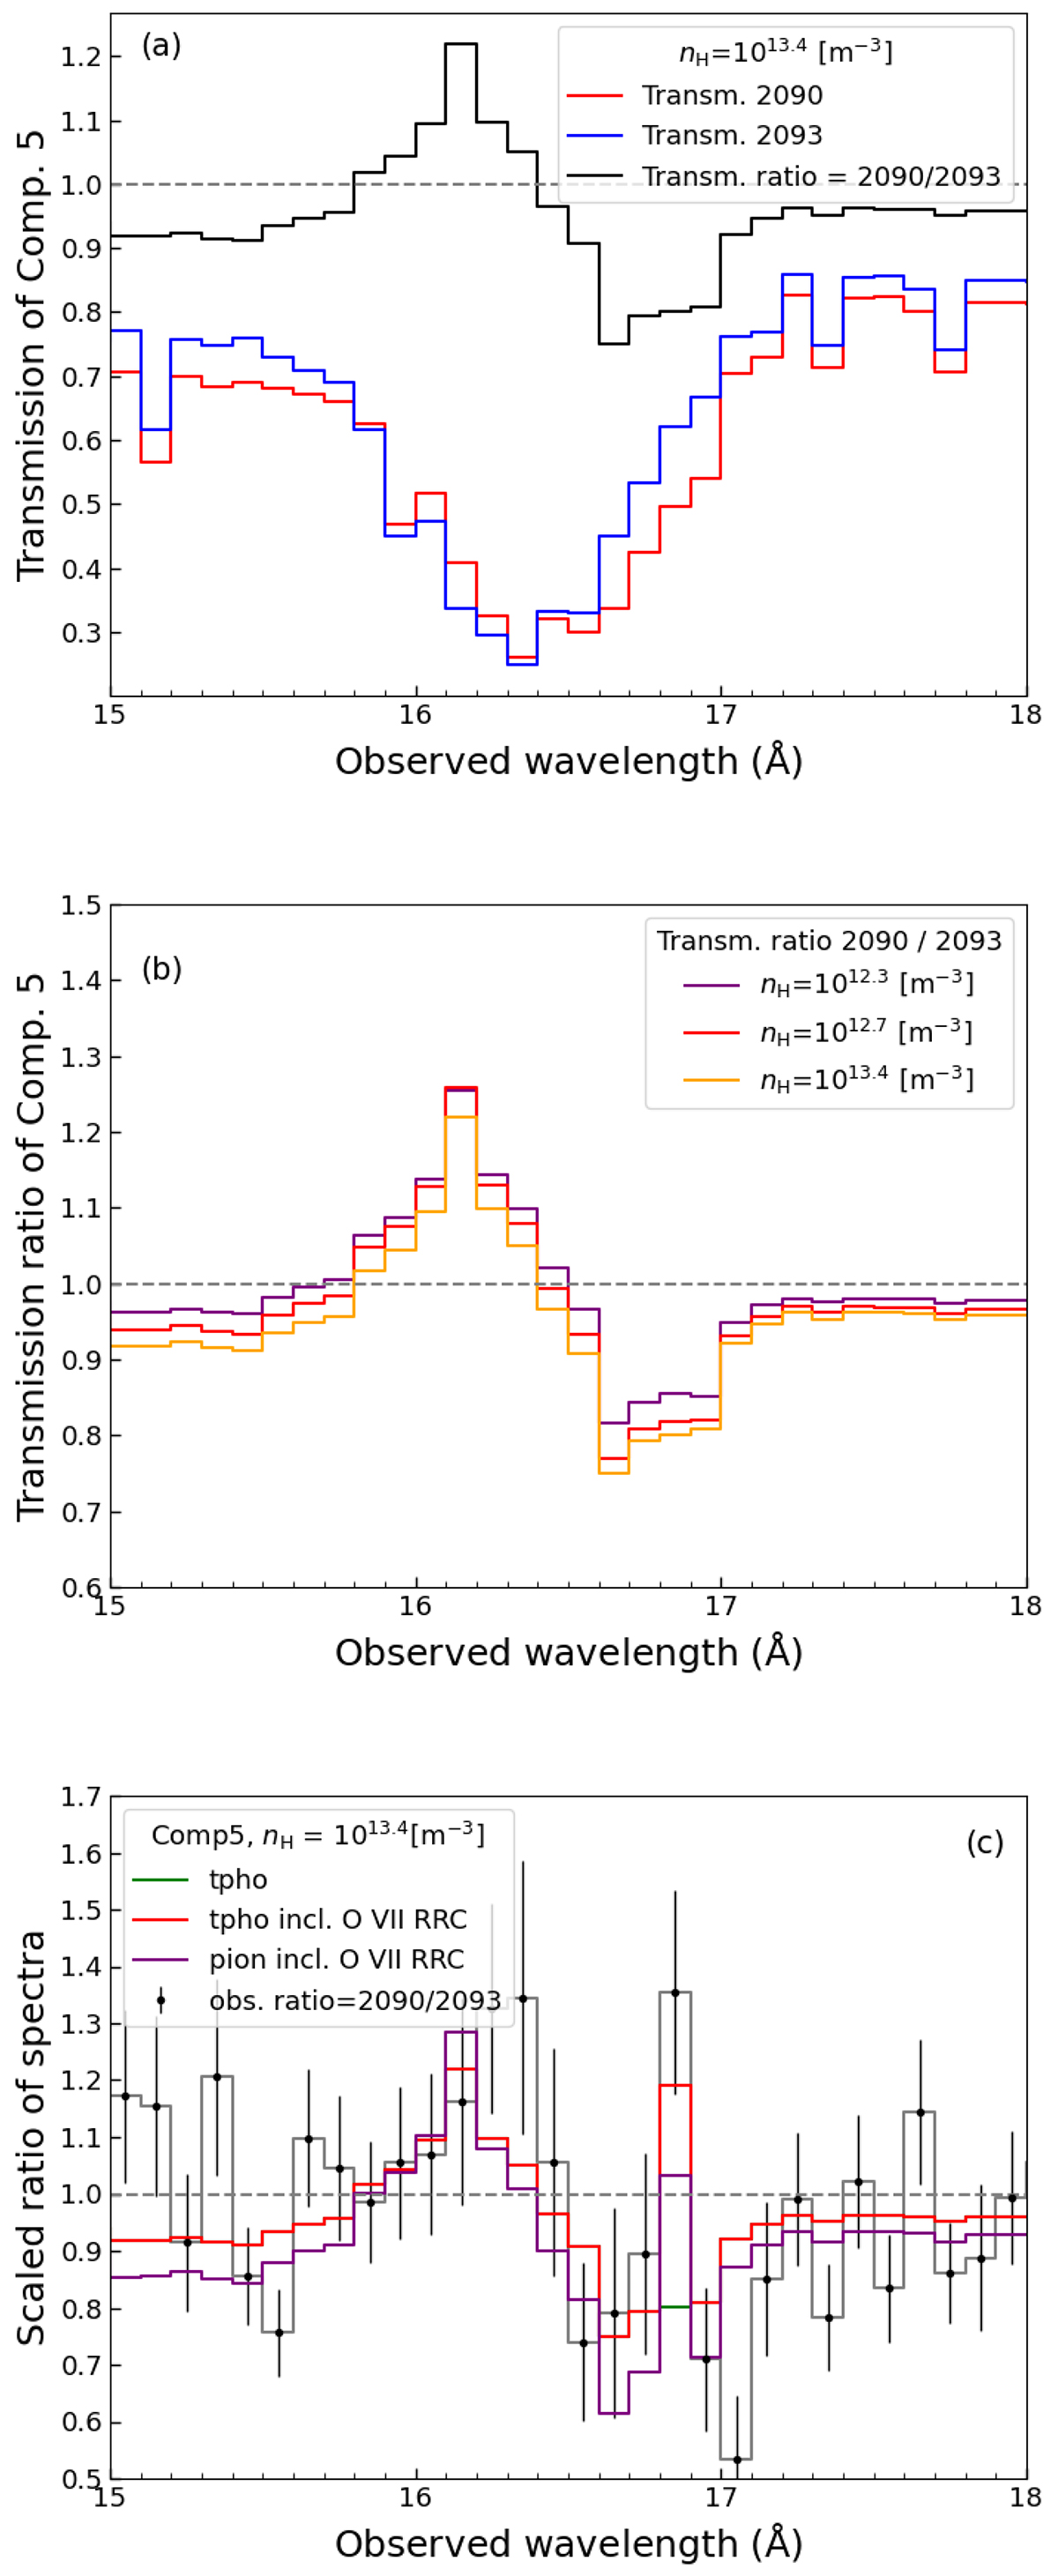
Models from tpho for component 5 in the 15 − 18 Å binned with 0.1 Å. Panel a shows the transmission of component 5 in the high-flux state (blue) and low-flux state (red) and the transmission ratio (black) from the low-flux state over the high-flux state. Panel b shows the transmission ratio of component 5 as a function of increasing density. Panel c shows the observed ratio (black) was fitted well by the tpho model with a density of 1013.4 m−3 including the O VII RRC feature (red). The local scaling factor of 2.21 was calculated from the counts in the 9 − 14 Å range.
Current usage metrics show cumulative count of Article Views (full-text article views including HTML views, PDF and ePub downloads, according to the available data) and Abstracts Views on Vision4Press platform.
Data correspond to usage on the plateform after 2015. The current usage metrics is available 48-96 hours after online publication and is updated daily on week days.
Initial download of the metrics may take a while.