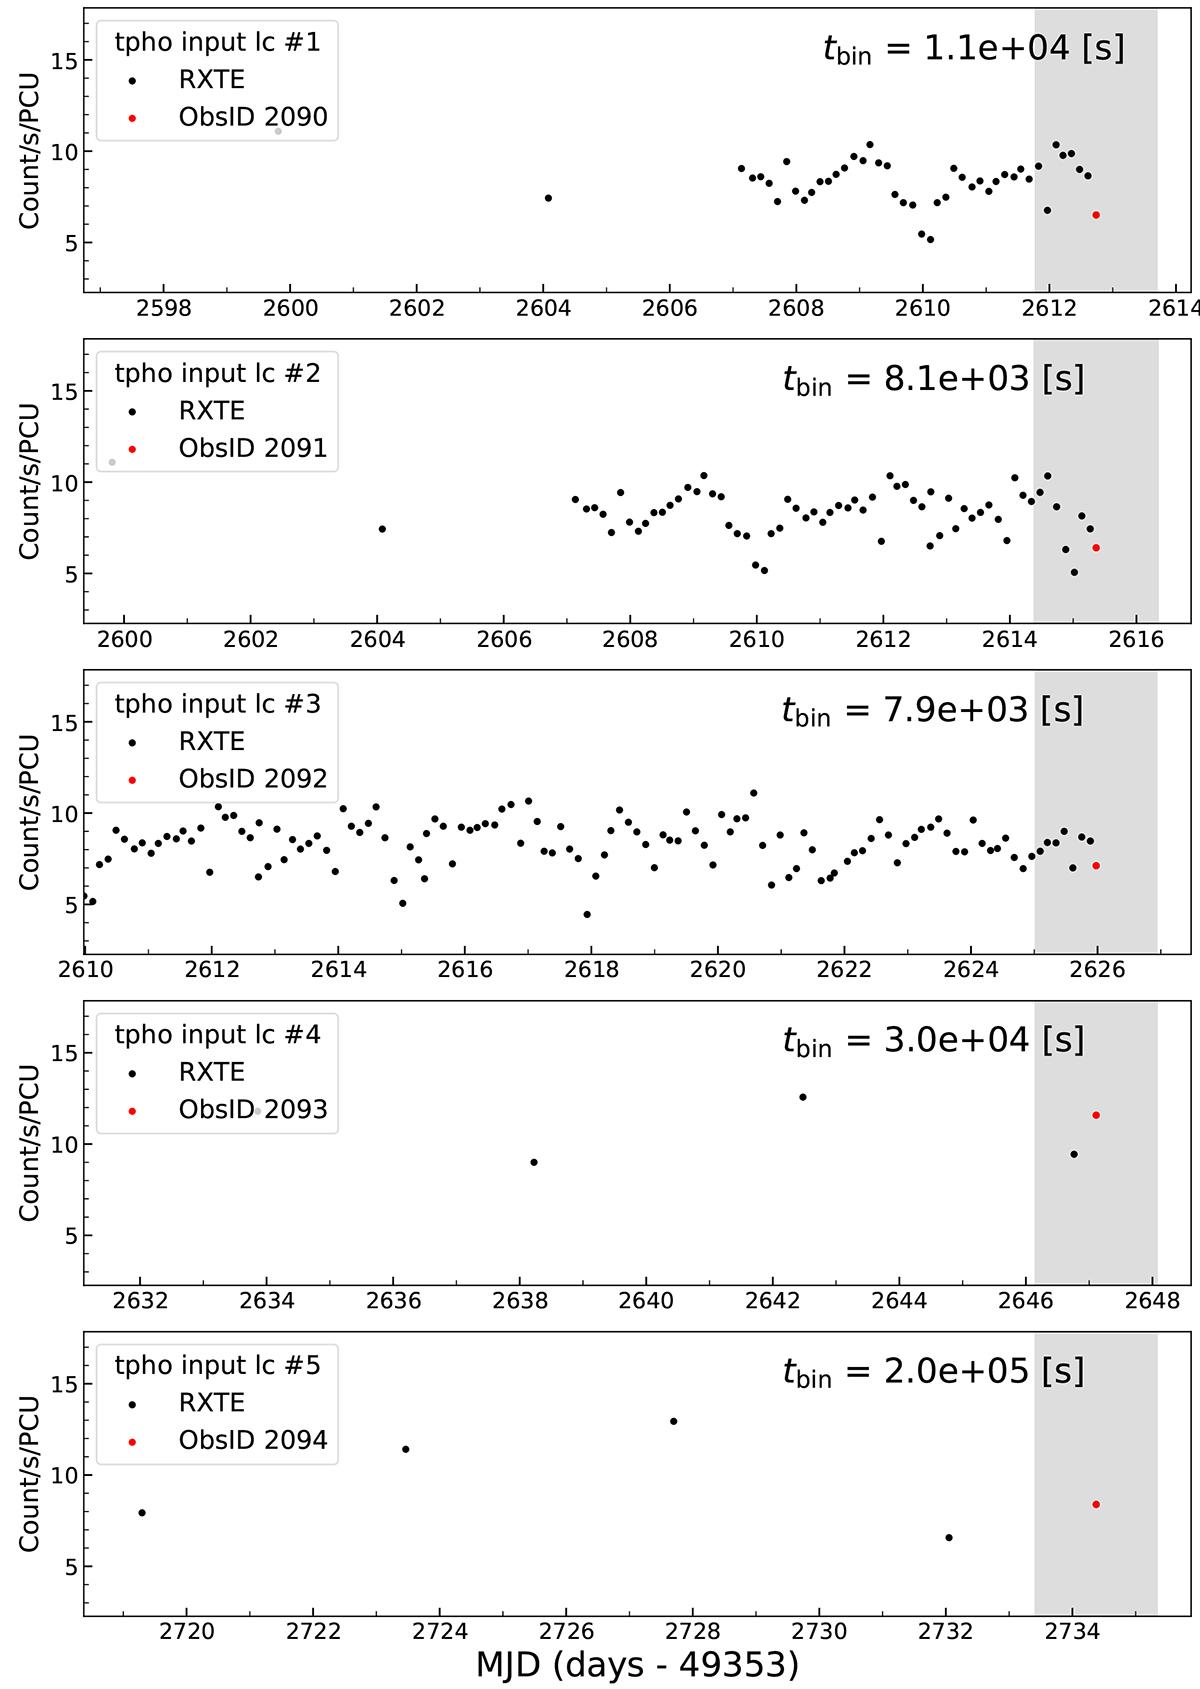
Fig. 4.
Download original image
RXTE light curve used as input for each tpho component calculation with the same starting data point from 1800 MJD. We show the part of the light curve within 14 days before the Chandra observation (red dot) corresponding to each component. The markers are similar to Fig. 3. The time resolution (tbin) in units of seconds was defined by the time difference between the Chandra observation and the last RXTE observation before it.
Current usage metrics show cumulative count of Article Views (full-text article views including HTML views, PDF and ePub downloads, according to the available data) and Abstracts Views on Vision4Press platform.
Data correspond to usage on the plateform after 2015. The current usage metrics is available 48-96 hours after online publication and is updated daily on week days.
Initial download of the metrics may take a while.