Open Access
Fig. 12.
Download original image
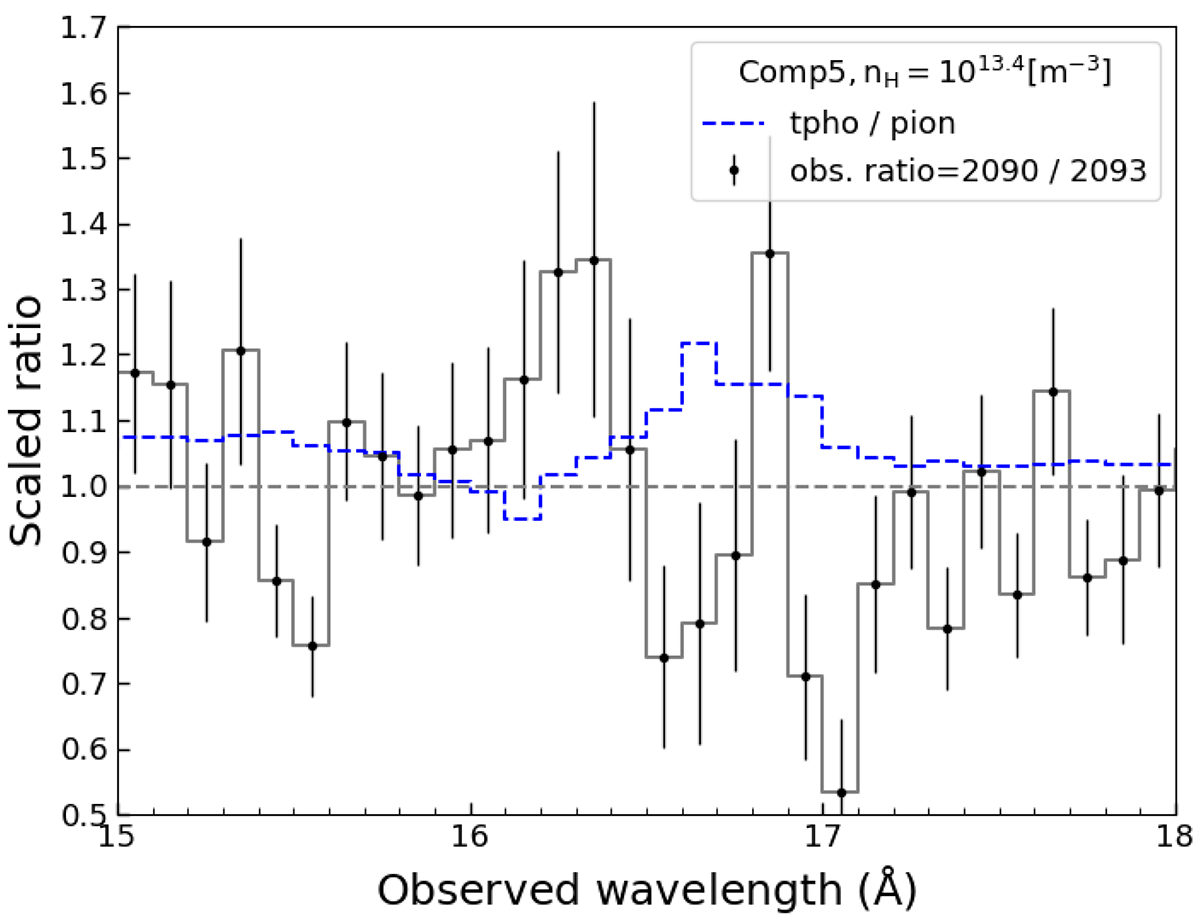
Observation ratio is compared to the transmission ratio of component 5 with different assumptions. The observation ratio of ObsID 2090 to 2093 is illustrated with a black curve, and the transmission ratio of non-equilibrium (tpho) over equilibrium (pion) is represented by the blue line.
Current usage metrics show cumulative count of Article Views (full-text article views including HTML views, PDF and ePub downloads, according to the available data) and Abstracts Views on Vision4Press platform.
Data correspond to usage on the plateform after 2015. The current usage metrics is available 48-96 hours after online publication and is updated daily on week days.
Initial download of the metrics may take a while.