Open Access
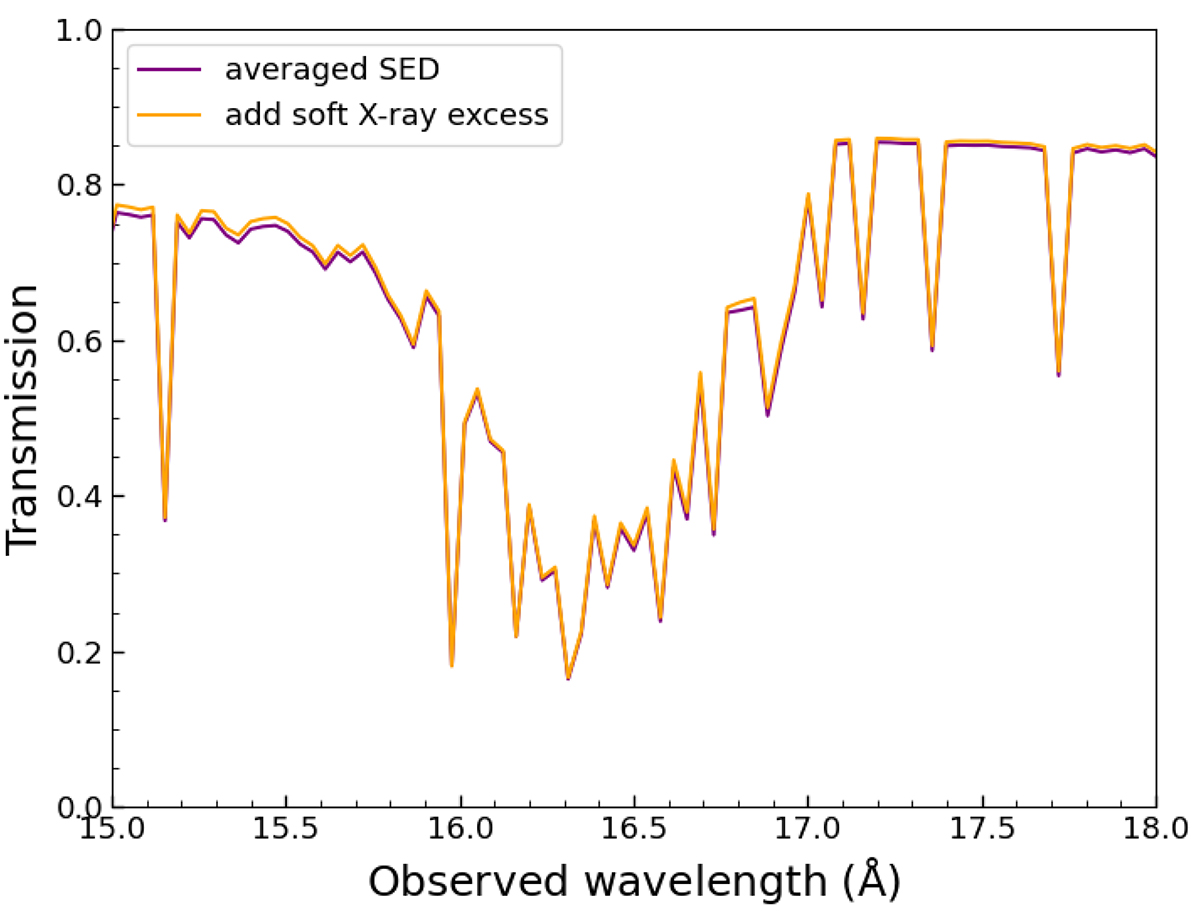
Fig. 10.
Download original image
Transmission of component 5 with the pion calculation by using different SED. The purple line indicates the averaged SED, and the orange curve denoted the SED adding soft X-ray excess in wavelength of 10 − 30 Å.
Current usage metrics show cumulative count of Article Views (full-text article views including HTML views, PDF and ePub downloads, according to the available data) and Abstracts Views on Vision4Press platform.
Data correspond to usage on the plateform after 2015. The current usage metrics is available 48-96 hours after online publication and is updated daily on week days.
Initial download of the metrics may take a while.