Fig. D.1
Download original image
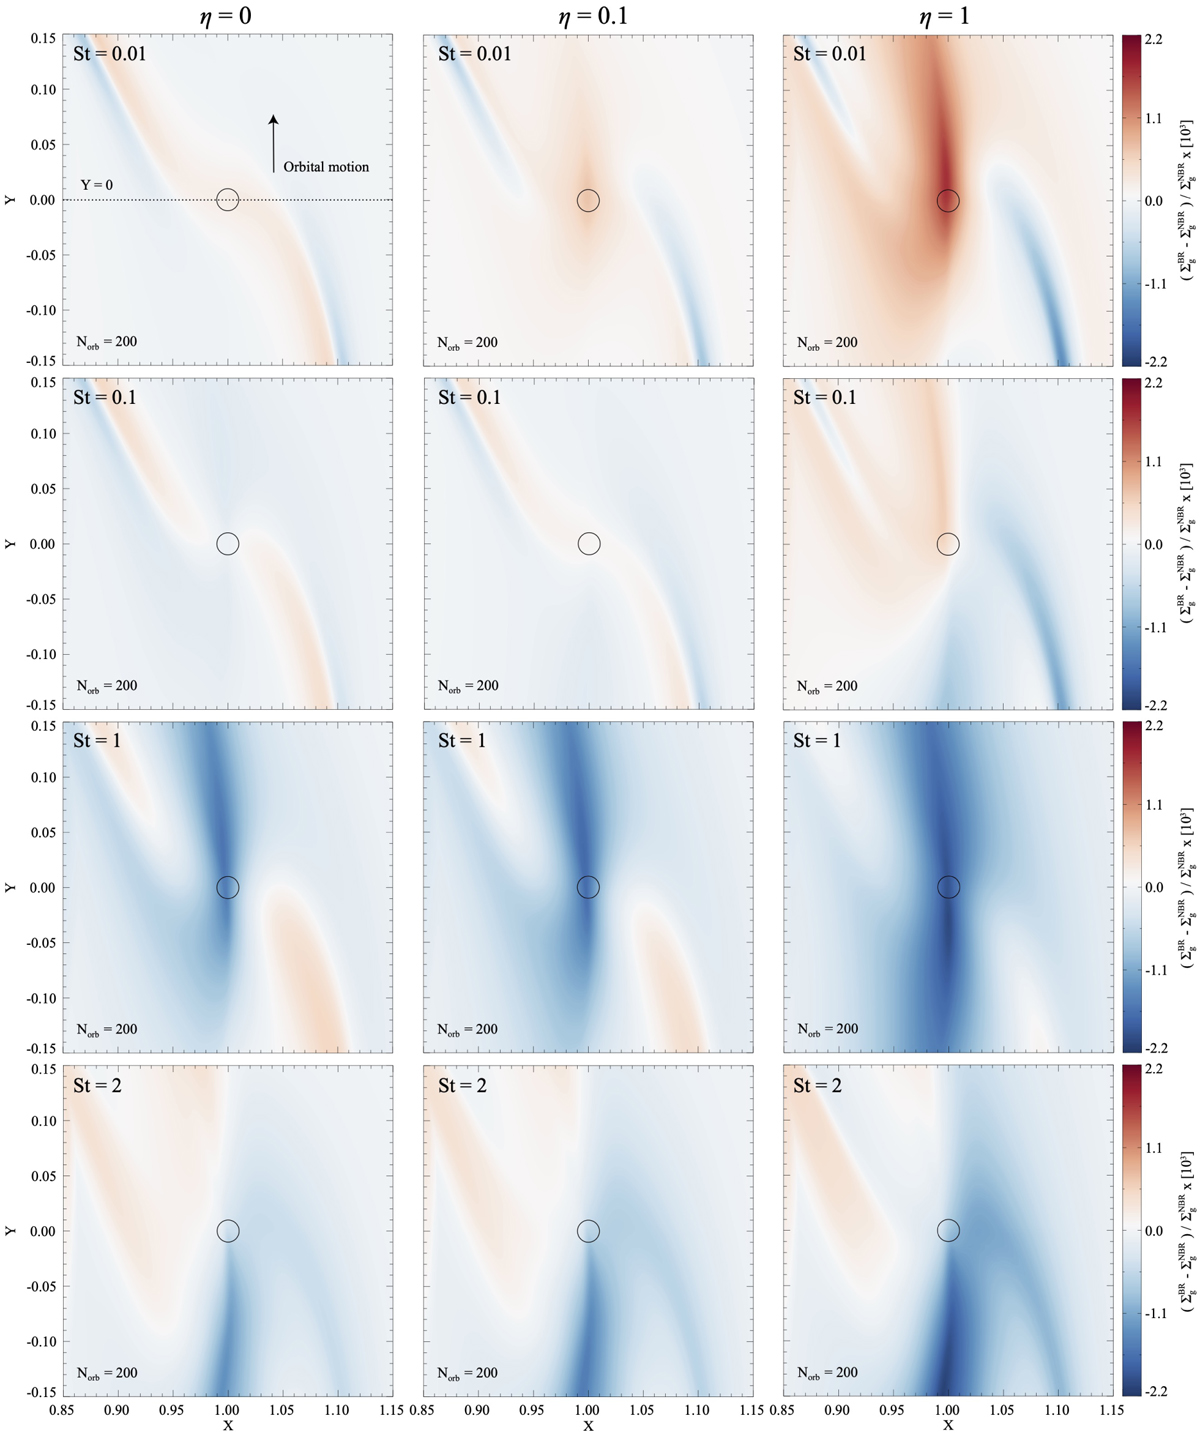
Comparison of gas density distributions in NBR and BR models for St = 0.01, 0.1, 1, and 2, with three different accretion efficiencies (η = 0, 0.1, and 1), in the vicinity of 1 M⊕ planet. The axes are shown in code units. Colors ranging from blue to red represent increasing gas densities in the BR models. Regions where the two models agree are show in white. The black circle indicates the planetary Hill sphere. Note that the density ratios are multiplied by 1000 for clarity.
Current usage metrics show cumulative count of Article Views (full-text article views including HTML views, PDF and ePub downloads, according to the available data) and Abstracts Views on Vision4Press platform.
Data correspond to usage on the plateform after 2015. The current usage metrics is available 48-96 hours after online publication and is updated daily on week days.
Initial download of the metrics may take a while.