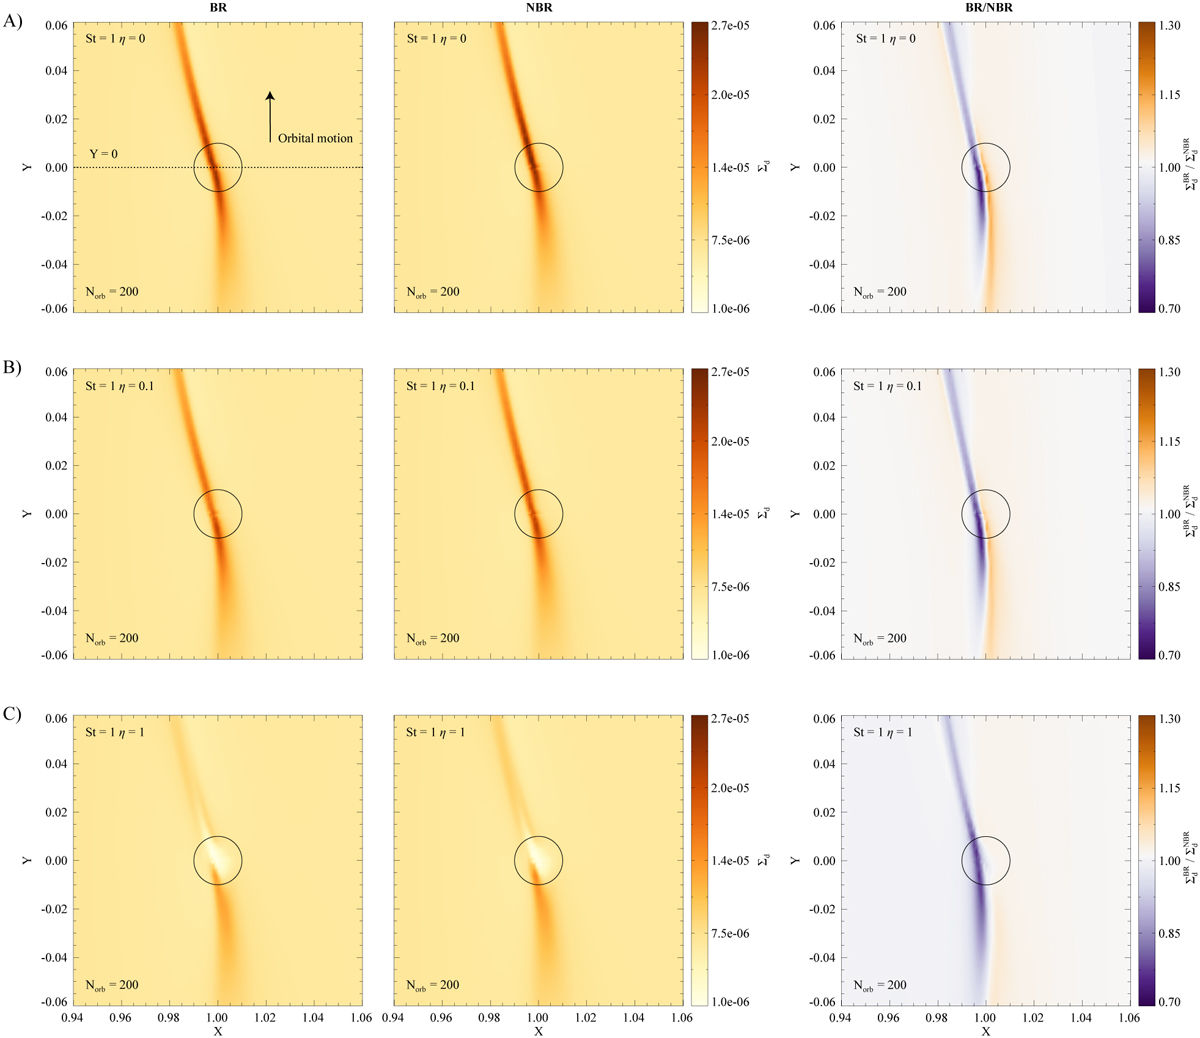
Fig. 3
Download original image
Distribution of St = 1 solid material in the vicinity of an 1 M⊙ planet in BR and NBR models assuming η = 0 (panels A), η = 0.1 (panels B), and η = 1 (panels C) with p = 0.5. The density ratio of the BR and NBR models are also shown on the left. The circles represent the planetary Hill sphere. The axes are shown in code units.
Current usage metrics show cumulative count of Article Views (full-text article views including HTML views, PDF and ePub downloads, according to the available data) and Abstracts Views on Vision4Press platform.
Data correspond to usage on the plateform after 2015. The current usage metrics is available 48-96 hours after online publication and is updated daily on week days.
Initial download of the metrics may take a while.